Matplotlib is a Python library used for plotting. Plots enable us to visualize data in a pictorial or graphical representation.
Matplotlib is a widely used Python based library; it is used to create 2d Plots and graphs easily through Python script, it got another name as a pyplot. By using pyplot, we can create plotting easily and control font properties, line controls, formatting axes, etc.
Matplotlib Tutorial
In this Matplotlib Tutorial, you will learn how to visualize data and new data structures along the way you will master control structures which you will need to customize the flow of your scripts and algorithms.
This tutorial is all about data visualization. Using data, Matplotlib creates 2d Plots and graphs, which is an essential part of data analysis. Recent years we have seen data visualization has got massive demand like never before. Organizations realized that without data visualization it would be challenging them to grow along with the growing completion in the market.
Data visualization is a modern visualization communication. It involves the creation and study of the visual representation of data. Which is used to make the decision-making process and helps to quickly understand the analytics presented visually so everyone can grasp difficult concepts or identify new patterns.
Matplotlib Plot Tutorials
Matplotlib can be used to draw different types of plots. The plot types are:
- Scatter Plot
- Bar Graph
- Histogram
- Pie Plot
- Area Plot
- Hexagonal Bin Plot
Matplotlib Basic Example
Enough with all the theory about Matplotlib. Let use dive into it and create a basic plot with Matplotlib package.
example.py
import matplotlib.pyplot as pyplot

pyplot.plot([1, 2, 3, 4, 5, 6],[4, 5, 1, 3, 6, 7])
pyplot.title('TutorialKart')
pyplot.show()
The first argument to the plot() function, which is a list [1, 2, 3, 4, 5, 6] is taken as horizontal or X-Coordinate and the second argument [4, 5, 1, 3, 6, 7] is taken as the Y-Coordinate or Vertical axis. pyplot.title() function sets the title to the plot. pyplot.show() displays the plot in a window with many options like moving across different plots, panning the plot, zooming, configuring subplots and saving the plot.

Matplotlib Scatter Plot
Scatter plot uses Cartesian coordinates to display values for two variable data set. You can use Matplotlib pyplot.scatter() function to draw scatter plot.
example.py
import matplotlib.pyplot as pyplot

# data
a = [2,4,6,8,10,11,11.5,11.7]
b = [1,1.5,2,2.5,3,3.5,4,4.5]

# matplotlib plot
pyplot.scatter(a,b,label='Scatter Plot 1',color='r')
pyplot.xlabel('some x label')
pyplot.ylabel('some y label')
pyplot.title('Scatter Plot Example')
pyplot.legend()
pyplot.show()
In this example, we have taken data with two variables. Each variable’s data is a list.

You can draw multiple scatter plots on the same plot. Following example demonstrates how to draw multiple scatter plots on a single plot.
example.py
import matplotlib.pyplot as pyplot

# data
a = [2,4,6,8,10,11,11.5,11.7]
b = [1,1.5,2,2.5,3,3.5,4,4.5]
ab=[8,8.5,9,9.5,10,10.5,11]
cd=[3,3.5,3.7,4,4.5,5,5.2]

# matplotlib plot
pyplot.scatter(a,b,label='Scatter Plot 1',color='r')
pyplot.scatter(ab,cd,label='Scatter Plot 2',color='b')
pyplot.xlabel('some x label')
pyplot.ylabel('some y label')
pyplot.title('Scatter Plot Example')
pyplot.legend()
pyplot.show()
In this example, we have drawn two Scatter plot

Matplotlib Bar Graph
You can use bar graph when you have a categorical data and would like to represent the values proportionate to the bar lengths.
In the following example, we take the years as a category and the number of movies released in each year as the value for each category. pyplot.bar() function is used to draw Bar Graph.
example.py
from matplotlib import pyplot as plt
from matplotlib import style

style.use('ggplot')

x = ['2016','2017','2018']
y = [1252,1632,1692]

plt.bar(x, y, align='center')

plt.title('Dummy Movies Info')
plt.ylabel('Number of Movies Released')
plt.xlabel('Year')

plt.show()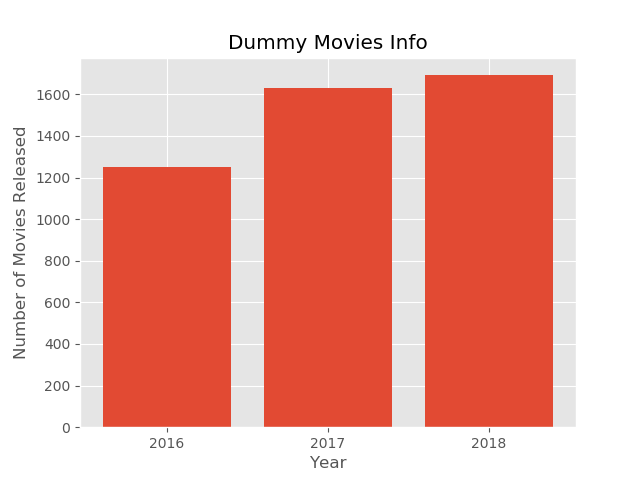
Matplotlib Histogram
Histograms are used to estimate the probability distribution of a continuous variable. The most common example that we come across is the histogram of an image where we try to estimate the probability distribution of colors.
In the following example, we take a random variable and try to estimate the distribution of this random variable. We will use pyplot.hist() function to build histogram.
example.py
from matplotlib import pyplot as plt
from matplotlib import style
import random

x = random.sample(range(1, 5000), 1000)
num_bins = 100
n, bins, patches = plt.hist(x, num_bins, facecolor='green', alpha=0.5)

plt.title('Histogram Example')
plt.xlabel('Values')
plt.xlabel('Counts')
plt.show()
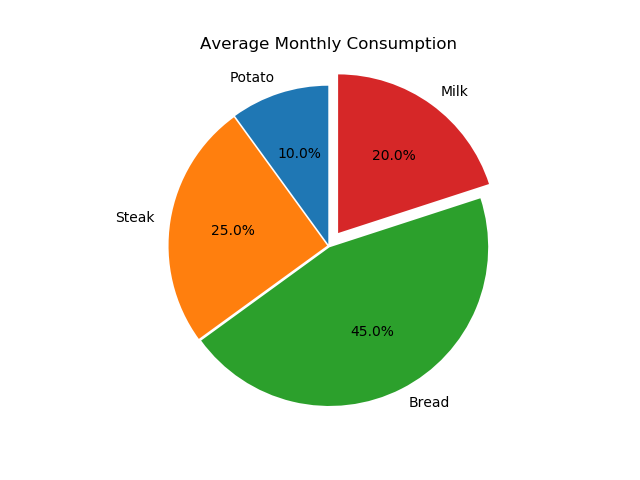
Matplotlib Pie Plot
The behavior of Pie Plots are similar to that of Bar Graphs, except that the categorical values are represented in proportion to the sector areas and angles.
In this example, we will use pyplot.pie() function to draw Pie Plot. We use labels to label the sectors, sizes for the sector areas and explode for the spatial placement of the sectors from the center of the circle.
example.py
import matplotlib.pyplot as plt

# Pie chart, where the slices will be ordered and plotted counter-clockwise:
labels = 'Potato', 'Steak', 'Bread', 'Milk'
sizes = [10, 25, 45, 20]
explode = (0.01, 0.01, 0.01, 0.1)  # explode 'Milk' a little away

fig1, ax1 = plt.subplots()
ax1.pie(sizes, explode=explode, labels=labels, autopct='%1.1f%%',
        shadow=False, startangle=90)
ax1.axis('equal')  # Equal aspect ratio ensures that pie is drawn as a circle.

plt.title('Average Monthly Consumption')

plt.show()