 TutorialKart.com
SciPy K-Means clustering with scipy.cluster.vq.kmeans()
SciPy K-Means is available in the scipy.cluster.vq module. The kmeans() function groups observation vectors into k clusters and returns the cluster centroids along with the final distortion value. In this tutorial, we shall learn the syntax and usage of kmeans() with SciPy K-Means examples.
In SciPy’s vector quantization workflow, kmeans() finds the centroids, while vq() can be used after that to assign each observation to the nearest centroid. For many practical examples, the input features are first scaled using whiten() so that features with larger numeric ranges do not dominate the distance calculation.
SciPy kmeans() syntax for clustering observation vectors
centroids,distortion = scipy.cluster.vq.kmeans(obs, k_or_guess, iter=20, thresh=1e-05, check_finite=True)The syntax above shows the commonly used arguments. Some SciPy versions may also expose an additional random-number control argument in the documentation. The main inputs remain the observation array and either the number of centroids or an initial centroid guess.
Parameters of scipy.cluster.vq.kmeans()
| Parameter | Optional/ Required | [datatype] Description |
| obs | Required | [ndarray] Each row of the M by N array is an observation vector. The columns are the features seen during each observation. The features must be whitened first with the whiten function. |
| k_or_guess | Required | [int or ndarray] The number of centroids to generate. A code is assigned to each centroid, which is also the row index of the centroid in the code_book matrix generated. |
| iter | Optional | [int] The number of times to run k-means, returning the codebook with the lowest distortion. This argument is ignored if initial centroids are specified with an array for the k_or_guess parameter. This parameter does not represent the number of iterations of the k-means algorithm. |
| thresh | Optional | [float] Terminates the k-means algorithm if the change in distortion since the last k-means iteration is less than or equal to thresh. |
| check_finite | Optional | [boolean] Whether to check that the input matrices contain only finite numbers. Disabling may give a performance gain, but may result in problems (crashes, non-termination) if the inputs do contain infinities or NaNs. Default: True |
| centroids | [Returned value] | [ndarray] A k by N array of k centroids. |
| distortion | [Returned Value] | [float] The distortion between the observations passed and the centroids generated. |
Values provided for the optional arguments are default values. The obs array should be two-dimensional for multi-feature clustering, where each row is one observation and each column is one feature.
How SciPy K-Means uses whiten(), kmeans(), and vq()
A typical SciPy K-Means workflow has three steps. First, prepare an array of observation vectors. Second, scale the features with whiten() when the feature ranges are different. Third, run kmeans() to calculate centroids and optionally use vq() to assign cluster codes to observations.
whiten(): normalizes each feature by its standard deviation.kmeans(): calculates the centroid locations for the requested number of clusters.vq(): compares each observation with the centroids and returns the nearest centroid code.
This distinction is important because kmeans() by itself does not return a label for every input row. It returns the centroids and the distortion value. Use vq() when you need cluster assignments.
SciPy K-Means example with random 2-D points
In this example, we shall generate a set of random 2-D points, centered around 3 centroids.
# import numpy
from numpy import vstack,array
from numpy.random import rand

# matplotlib
import matplotlib.pyplot as plt

# scipy
from scipy.cluster.vq import kmeans,vq,whiten

data = vstack(((rand(20,2)+1),(rand(20,2)+3),(rand(20,2)+4.5)))

plt.plot(data[:,0],data[:,1],'go')
plt.show()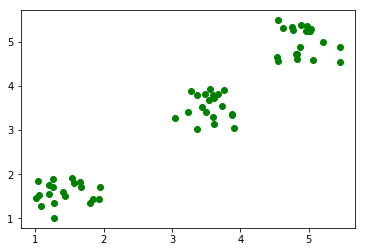
The first plot shows the generated points before clustering. The points are visually grouped around three areas, so we ask kmeans() to find 3 clusters.
# whiten the features
data = whiten(data)

# find 3 clusters in the data
centroids,distortion = kmeans(data,3)

print('centroids  : ',centroids)
print('distortion :',distortion)
plt.plot(data[:,0],data[:,1],'go',centroids[:,0],centroids[:,1],'bs')
plt.show()
centroids : [[ 1.42125469 1.58213817]
[ 3.55399219 3.53655637]
[ 4.91171555 5.02202473]]
distortion : 0.35623898893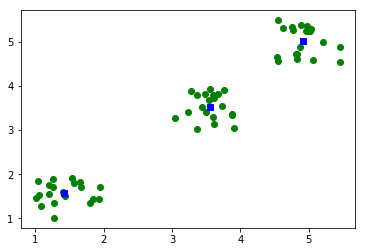
The blue square markers in the plot represent the cluster centroids returned by kmeans(). Since this example uses random input data, the exact centroid values and distortion may vary when the program is run again.
Assigning cluster labels with scipy.cluster.vq.vq()
The next example uses a small fixed data set so that the result is easier to understand. We pass an initial centroid guess to kmeans() and then call vq() to find the cluster code for each observation.
import numpy as np
from scipy.cluster.vq import kmeans, vq

observations = np.array([
    [1.0, 1.0],
    [1.2, 0.8],
    [4.0, 4.0],
    [4.2, 3.8]
])

initial_centroids = np.array([
    [1.0, 1.0],
    [4.0, 4.0]
])

centroids, distortion = kmeans(observations, initial_centroids)
codes, distances = vq(observations, centroids)

print("centroids:")
print(centroids)
print("cluster codes:", codes)
print("distances:", distances)
Output
centroids:
[[1.1 0.9]
 [4.1 3.9]]
cluster codes: [0 0 1 1]
distances: [0.14142136 0.14142136 0.14142136 0.14142136]
The cluster code is the index of the nearest centroid. In this output, the first two observations belong to centroid 0, and the last two observations belong to centroid 1.
Using k_or_guess as a cluster count or initial centroids
The k_or_guess argument can be used in two ways. If you pass an integer, SciPy chooses initial centroids from the observations and runs k-means. If you pass an array, that array is treated as the initial centroid guess.
| Value passed to k_or_guess | How SciPy kmeans() uses it |
|---|---|
3 | Finds 3 centroids, using internally selected initial centroids. |
np.array([[1, 1], [4, 4]]) | Starts with the supplied centroid positions and refines them. |
Passing an initial centroid array is useful when you want more control over the starting point of the algorithm. Passing an integer is simpler when you only know the number of clusters you want.
Understanding distortion in SciPy K-Means output
The distortion value returned by kmeans() measures the average distance between observations and their nearest centroids. A smaller distortion usually means the observations are closer to their assigned centroids, but distortion should be compared carefully because it depends on scaling, number of clusters, and the data itself.
Do not compare distortion values from unscaled and scaled data as if they are the same measurement. If you apply whiten(), the distance calculation is performed on the whitened feature values.
Common SciPy K-Means mistakes to avoid
- Importing the wrong module name: use
scipy.cluster.vq, notscipy.cluster.vp. - Expecting labels from kmeans():
kmeans()returns centroids and distortion. Usevq()to assign labels. - Skipping feature scaling: when feature ranges differ greatly, use
whiten()or another suitable scaling method before clustering. - Misreading iter: the
iterargument controls repeated k-means runs with different initial centroids whenk_or_guessis an integer. It is not the number of inner update steps. - Using NaN or infinite values: keep
check_finite=Trueunless you have already validated the input array.
FAQs on SciPy K-Means clustering
What does scipy.cluster.vq.kmeans() return?
scipy.cluster.vq.kmeans() returns two values: the centroid array and the distortion value. It does not directly return one cluster label for every observation.
How do I get cluster labels after SciPy kmeans()?
Use scipy.cluster.vq.vq() with the original observations and the centroids returned by kmeans(). The first value returned by vq() contains the nearest centroid code for each observation.
Why is whiten() used before SciPy K-Means?
whiten() scales each feature by its standard deviation. This helps prevent a feature with larger numeric values from dominating the Euclidean distance used by k-means.
What is the difference between kmeans() and kmeans2() in SciPy?
kmeans() returns centroids and distortion. kmeans2() is another SciPy clustering function that can return centroid labels directly along with the centroids. The function you choose depends on the output format and initialization behavior you need.
Can SciPy K-Means be used for more than two features?
Yes. Each row in the observation array is one observation, and each column is one feature. A data set with five features should be shaped like (number_of_observations, 5).
Editorial QA checklist for this SciPy K-Means tutorial
- Confirm that all references use
scipy.cluster.vqand not the incorrectscipy.cluster.vp. - Check that existing code blocks and image URLs remain unchanged.
- Verify that the tutorial explains the difference between
kmeans()centroids andvq()cluster labels. - Make sure the discussion of
iterstates that it is not the number of internal k-means update iterations. - Confirm that the FAQ questions are specific to SciPy K-Means,
whiten(),vq(), output values, and multi-feature clustering.