Unified Modeling Language – UML Tutorial
A Unified Modeling Language is a language for specifying, constructing, visualizing and documenting the software system and its components. UML is a graphical language with a set of rules and semantics. The rules and semantics of a model are expressed in English, in a form known as object constraint language. A model is basically an abstract representation of the system, constructed to understand the system prior to building it.
Goals in designing of UML
- Provide user a ready to use,expressive visual modeling language to develop meaningful models.
- Support high-level development concepts.
- Integrate best practices with methodologies.
- Provide extensibility and specialization mechanism to extend core concepts.
UML diagrams
To design a complex system, single view is insufficient. So, UML has given a set of nearly independent vies of a model. UML defines nine graphical diagrams:
UML Class diagram
The UML class diagram is also referred as object modeling, is a collection of static modeling elements such as classes and their relationships, connected as a graph to each other. Class diagram is a static model i.e., the data won’t change with respect to time.
Class notation
A class is drawn as a rectangle with three components separated by horizontal lines.
- The top name compartment holds the class name
- Middle compartment holds the attributes i.e the properties of the class
- Bottom compartment holds the list of operations.
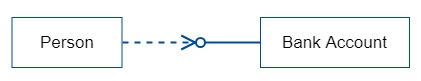
Class interface notation
Class interface notation is used to describe the visible behavior of the class. Visible behavior of the class may be public, private or protected.
The UML notation for an interface is a small circle with the name of the interface connected to the class and the class that requires the operations in the interface may be attached to a circle by a dashed arrow.
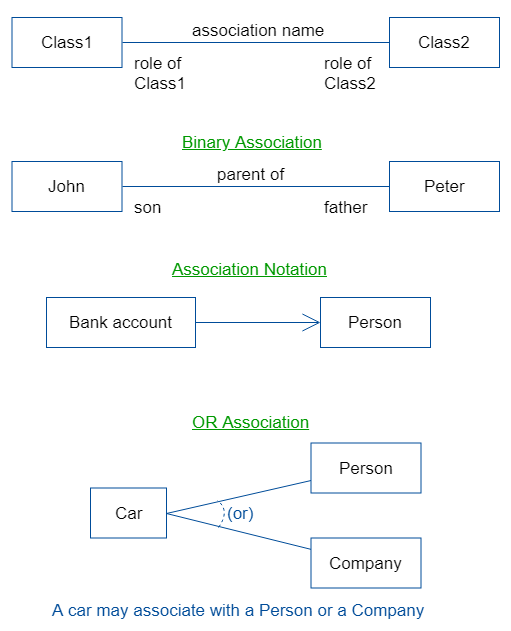
Association
Association represents a physical or conceptual connection between two or more objects. Binary association and OR- association are common types of association.
Binary association is an association between two objects or classes. Binary association is drawn as a solid line connecting two class symbols. The end of connection, where it connects to class, is called the association role.
OR association is an association in which single object have several potential associations at one time.
Qualifier
A qualifier is an attribute. For example, a student object may be associated to university object. An attribute of this association is the register number. Here register number is the qualifier.
Qualifier is shown as a small rectangle attached to the end of association path. A qualifier rectangle is part of the association path, not the path of class.
Multiplier
Multiplicity specifies the range of allowable association classes. Multiplicity specification is shown as a text string comprising a period –separated sequence of integer intervals.
lower_bound..upper_bound
In between lower bound to upper bound there are integers.
Examples
- 0..1
- 0..* (star character(*) represents unlimited upper bound when it is used for the upperbound)
- 20..*
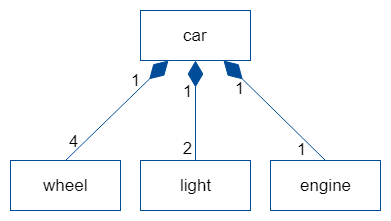
Aggregation and composition(a part of)
Aggregation is one form of association. Aggregation can be represented with a hollow diamond at the end of association path.
Composition is also known as a part of (or) part-whole relationship. Composition is a form of aggregation with strong ownership to represent the component of a complex object. It is denoted with a solid diamond at the end of path.
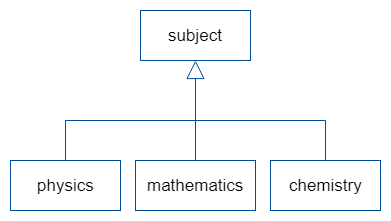
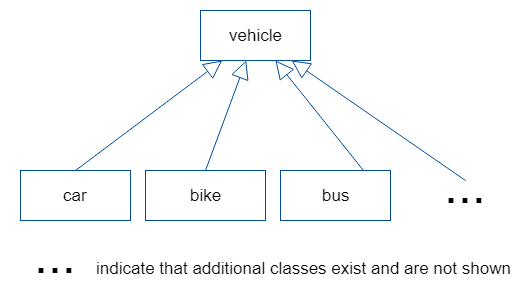
Generalization
Generalization is also referred as super-subclass relationship i.e., relationship between a more general class and a more specific class. Generalization is displayed as a directed line with a closed, hollow arrowhead at the super class end.
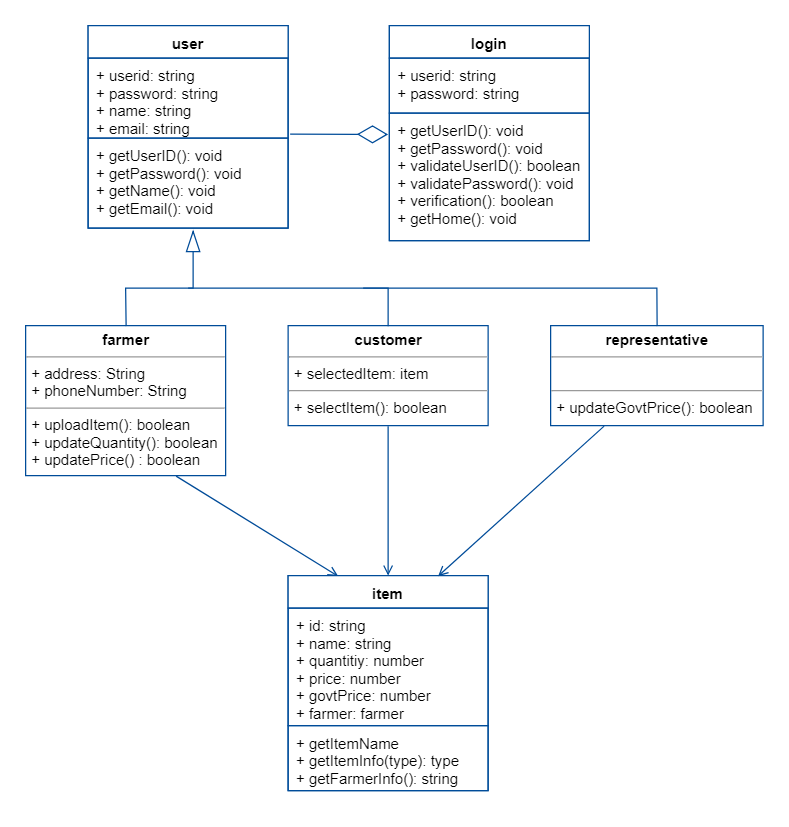
Class diagram Example
A simple example for a class diagram
Use-case diagram
A use case diagram is a graph of actors, a set of use cases enclosed by a system boundary. It also represents the associations between the actors an the usecases and generalization among the usecases. The basic elements in this diagram are :
Actor : An actor is anything that interacts with an usecase. An actor is shown as a rectangle with label <<actor>> , or the the stick figure with a label below.
Usecase: Usecase represents specific flow of actions in the system. Usecase is represented by a oval.
The relationships in usecase diagram
Uses/includes : This relationship between use case is shown by a generalization arrow from the usecase.
Extends : This relationship is used between super and sub classes.
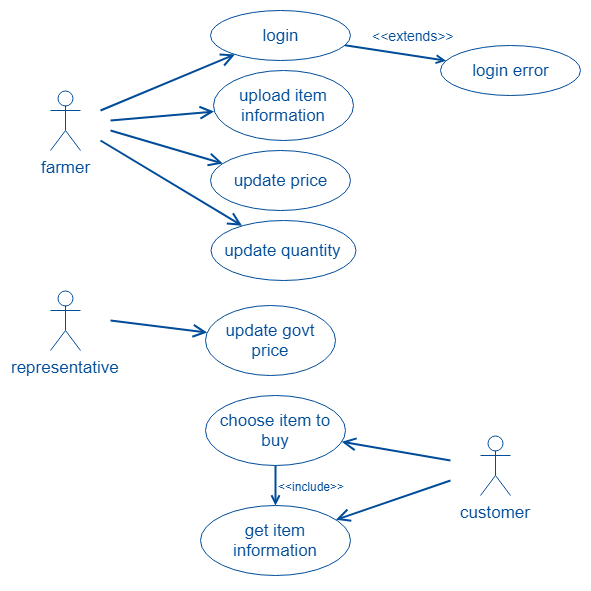
A use –case diagram shows the relationship among the actors and usecases with in a system
Behavior diagram (dynamic modeling)
Objects have states. The state of an object can’t be captured in static model. So, UML has dynamic modeling i.e., the data about the system will be changed with respect to time.
Interaction diagram
Interaction diagram shows the pattern of interaction among the objects and it captures the behavior of single usecase. There are two types of interaction diagrams:sequence diagram and collaboration diagram.
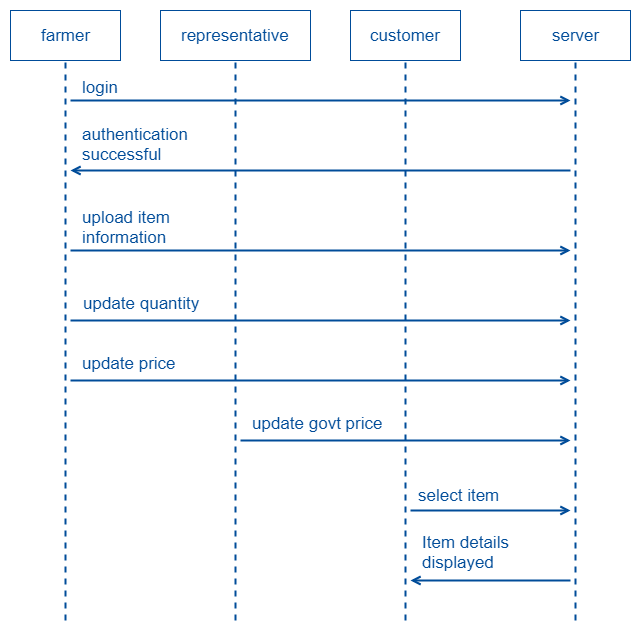
- Sequence diagram : Sequence diagram shows the interaction between the objects in sequential manner i.e., how actually they take place in a time sequence. A sequential diagram has two components:
- The vertical dimension represents time
- The horizontal dimension represents different objects
Vertical lines used to transfer messages between among the objects and the horizontal dashed lines represents lifeline i.e., object’s existence during interaction.
An example for sequence diagram
- Collaboration diagram : Collaboration diagram represents the collaboration, which is a set of objects related in a particular context and interaction, which is a set of messages exchanged among the objects with in the collaboration to get desired outcome. Notation for collaboration diagram is same as sequence diagram, but the collaboration diagram have numbering schemes to clear with sequence of messages between the objects. The numbering may be decimal numbering or simple numbering.
An example for collaboration diagram(decimal numbering)
Statechart diagram
State chart diagram shows the sequence of states that an object goes through during its life in response to outside stimuli and messages. Basically, a state is a set of values that describes an object at a specific point in time.
State is represented as around box which may contain one or more components. First component holds the state name and second compartment shows internal actions performed in response to events.start of the state is represented with dark dot and the end of the state is represented with a dark dot inside a circle.
There are two types of state diagrams :
- Simple state diagram
- Complex state diagram
A state diagram represents the state of method execution and used to understand the algorithm involved in performing a method.
Activity diagram
Activity diagram shows the overall business model of the system. The purpose of activity diagram is to provide a view of flows and to represent what is going on inside a usecase. The representation for the activity diagram is same as statechart diagram. The main difference between the activity diagram and the statechart diagram is that, statechart diagram focus on the events occurring to a single object where as activity diagram focus on overall activity of the system.
An example for activity diagram.
Implementation diagram
Implementation diagram shows the implementation phase of systems development. It represents the source code structure and run-time implementation structure. Basically there are two types of implementation diagrams. They are :
- Component diagram : Component diagram model the physical components in a design such as source code, executable program, user interface. A component diagram is a graph of design’s components connected by dependency relationship (one elements lies on another element such as client-supplier relationship).
An example for component digram
- Deployment diagram : A deployment diagram is a graph of nodes (software/hardware) connected by communication association. Deployment diagram basically shows how the software components are deployed in the hardware of the system. Nodes may be component instances, which means that the component runs or live at that node. Components are connected to other components by dashed arrow dependencies.connections between the nodes is given by solid lines.
Example for a Deployment diagram