 TutorialKart.com
After a MongoDB mongod process starts, it listens for client connections on its configured network interface and port. Applications, administration tools, monitoring agents, and MongoDB Shell sessions can each open one or more connections to the MongoDB Database.
In this tutorial, we shall learn how to check the current number of connections to a MongoDB server using the db.serverStatus() method, how to interpret the returned connection counters, and how connection pooling affects the values.
Check the Current MongoDB Connection Count
The db.serverStatus() command returns operational information about a MongoDB server. To display only the connection-related fields, run the following command from a connected MongoDB Shell session:
db.serverStatus().connectionsA typical result contains fields such as current, available, totalCreated, active, and threaded. The exact fields can vary by MongoDB version and deployment type.
{
  current: 12,
  available: 838848,
  totalCreated: 275,
  active: 3,
  threaded: 12
}
Following is a quick snapshot of the command run from a MongoDB Shell.
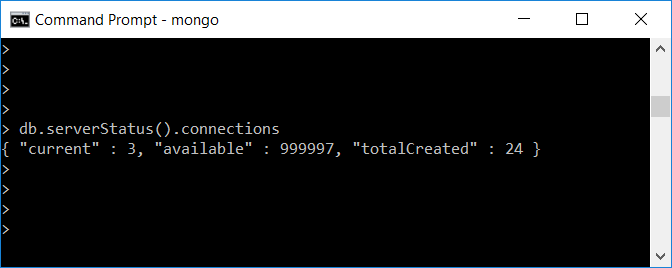
MongoDB connections.current, active, and available Fields
| Field | Meaning |
|---|---|
current | The number of incoming connections currently open to the MongoDB server. This can include active and idle connections. |
active | The number of connections currently performing work. This value is normally less than or equal to current. |
available | An estimate of how many additional incoming connections the server can accept under its configured and operating-system limits. |
totalCreated | The cumulative number of incoming connections created since the MongoDB process started. |
threaded | The number of connections assigned to threads where this field is reported by the server version. |
In the first screenshot, the current value is three. This means three incoming connections are open at that moment. It does not necessarily mean that all three connections are actively executing database operations.
The available value should not be interpreted as a universal MongoDB connection capacity. It depends on the server configuration, MongoDB version, deployment environment, operating-system file descriptor limits, process limits, and available resources.
Observe the MongoDB Connection Count Change
Open another MongoDB Shell session and connect it to the same server. Then run db.serverStatus().connections again from either shell.
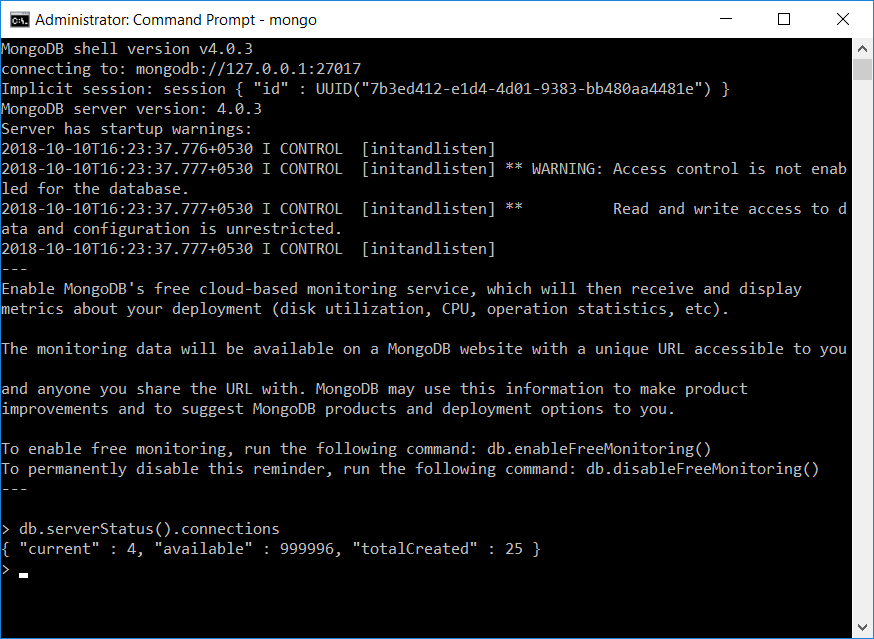
When the additional MongoDB Shell establishes a connection, the current count normally increases. The available count may decrease correspondingly. After the shell exits and the connection closes, the current count should fall again, although monitoring and application connections may cause the value to change continuously.
Display Only Selected MongoDB Connection Metrics
You can create a smaller result containing only the fields needed for routine monitoring.
const connections = db.serverStatus().connections;

printjson({
  current: connections.current,
  active: connections.active,
  available: connections.available,
  totalCreated: connections.totalCreated
});
This makes it easier to compare open connections, active work, remaining capacity, and cumulative connection creation.
Calculate MongoDB Connection Usage Percentage
A simple utilization estimate can be calculated from current and available. The total represented capacity is the sum of those two fields.
const c = db.serverStatus().connections;
const representedCapacity = c.current + c.available;
const usagePercent = representedCapacity === 0
  ? 0
  : (c.current / representedCapacity) * 100;

print(`Connection usage: ${usagePercent.toFixed(2)}%`);
This percentage is useful as an operational indicator, but it should not be treated as the only measure of database health. CPU usage, memory pressure, operation latency, queueing, file descriptors, and application behavior must also be considered.
MongoDB Connection Pooling and High Connection Counts
Most MongoDB drivers maintain a connection pool. Instead of creating a new network connection for every database operation, the driver keeps a set of reusable connections for the application process.
The number shown by connections.current can therefore be much higher than the number of application users. For example, multiple application instances may each maintain their own pool, and each pool can open several connections to each server it communicates with.
- One application process can open multiple MongoDB connections.
- Each application instance normally has its own connection pool.
- Replica set monitoring can require additional connections.
- Administrative tools, backup agents, and monitoring systems also add connections.
- Idle pooled connections can remain open even when no query is currently running.
Review driver-specific settings such as maximum pool size, minimum pool size, connection timeout, and maximum idle time before increasing server limits. Pool option names differ between drivers and versions.
Find Whether MongoDB Is Repeatedly Creating Connections
The totalCreated field is cumulative from the time the server process started. A rapidly increasing value can indicate frequent connection creation, application restarts, incorrectly reused clients, or ineffective connection pooling.
Take two samples over a known interval and compare them:
db.serverStatus().connections.totalCreatedFor example, if the first sample is 10,000 and the second sample five minutes later is 11,500, the server accepted 1,500 new connections during that interval. Whether that rate is expected depends on the application architecture and workload.
Check MongoDB Connections from the Operating System
Operating-system tools can show TCP connections associated with the MongoDB port. These commands provide a network-level view and may include connections in states that do not exactly match MongoDB’s server counters.
Count MongoDB port connections on Linux
ss -tan | grep ':27017' | wc -lTo inspect the matching socket records instead of only counting them, omit wc -l.
ss -tan | grep ':27017'Count MongoDB port connections on Windows
netstat -ano | findstr :27017Replace 27017 with the configured MongoDB port when the server uses a custom port.
MongoDB Maximum Connections and Server Limits
MongoDB does not have one practical maximum connection count that applies to every installation. The effective limit can depend on several factors:
- MongoDB server configuration and version
- Operating-system file descriptor and process limits
- Available memory and CPU resources
- Deployment type, including standalone servers, replica sets, sharded clusters, and MongoDB Atlas tiers
- The number and size of application connection pools
- Monitoring, backup, administration, and internal cluster connections
For MongoDB Atlas, connection limits vary by cluster configuration and service tier. Check the current Atlas limits for the selected deployment rather than relying on a value observed on a self-managed server.
Troubleshoot an Unexpectedly High MongoDB Connection Count
When the number of MongoDB connections is higher than expected, review the application and server in a structured order.
- Count the number of running application instances, containers, or server processes.
- Check the connection-pool settings used by each MongoDB client.
- Confirm that the application creates one reusable client per process instead of a new client for every request.
- Review whether deployment scaling recently added more application instances.
- Identify monitoring tools, administration clients, backup agents, and scheduled jobs.
- Track the rate of change in
totalCreatedto detect repeated connection churn. - Compare
activewithcurrentto distinguish busy connections from idle pooled connections. - Check server logs and application logs for timeouts, failed authentication attempts, and reconnect loops.
Increasing the server’s connection capacity without correcting excessive client creation can move the problem rather than solve it. First verify that applications reuse MongoDB clients and use appropriately sized pools.
MongoDB Connection Count FAQs
How do I check the current number of MongoDB connections?
Run db.serverStatus().connections from mongosh. The current field shows the number of incoming connections currently open to that MongoDB server.
Does connections.current show only active MongoDB queries?
No. The current value can include active and idle connections. Use the active field, when available, to see how many connections are currently performing work.
Why are there more MongoDB connections than application users?
MongoDB drivers use connection pools. Each application process or container can maintain several connections, and monitoring tools, shell sessions, replica set monitoring, and administrative services can add more.
What does totalCreated mean in MongoDB serverStatus?
totalCreated is the cumulative number of incoming connections created since the MongoDB server process started. It does not represent the number of connections currently open.
Is the MongoDB maximum connection count always one million?
No. The effective connection limit depends on the MongoDB deployment, server configuration, operating-system limits, hardware resources, and managed-service tier. The displayed available value applies to the server being inspected and should not be treated as a universal limit.
MongoDB Connection Monitoring QA Checklist
- Verify that
currentis described as open incoming connections, not only active queries. - Confirm that
active,available, andtotalCreatedare interpreted separately. - Do not present a screenshot’s
availablevalue as a universal MongoDB maximum. - Check whether application connection pools are included when explaining unexpectedly high counts.
- Confirm that Atlas limits are treated as deployment-specific rather than identical to self-managed MongoDB limits.
- Use the configured MongoDB port in operating-system commands when it differs from 27017.
MongoDB Connection Count Summary
Use db.serverStatus().connections to inspect the current number of connections to a MongoDB server. Read current together with active, available, and totalCreated to understand whether connections are open, actively working, repeatedly recreated, or approaching the server’s represented capacity.
In this MongoDB Tutorial, we have learned how to find the number of connections made to a MongoDB server, interpret the connection metrics, account for connection pooling, and troubleshoot unexpectedly high connection counts.