 TutorialKart.com
In this Tableau Tutorial, you will learn how to build views in Tableau manually by placing fields on worksheet shelves and automatically by using Show Me. You will also learn how dimensions, measures, date hierarchies, marks, filters, and workbook formats affect a Tableau visualization.
Building Views in Tableau Manually
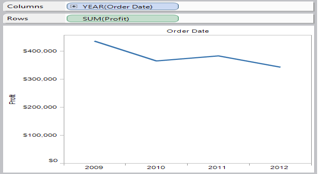
Building views in Tableau manually means dragging fields from the Data pane and dropping them onto the Rows shelf, Columns shelf, Marks card, Filters shelf, or other areas of the worksheet.
The structure of the view depends on the fields you select and where you place them. Dimensions generally divide or categorize the data, while measures provide values that Tableau aggregates, such as sales totals, quantities, or averages.
Tableau Worksheet Areas Used to Build a View
- Data pane: Contains the dimensions and measures available from the connected data source.
- Columns shelf: Creates horizontal headers or axes.
- Rows shelf: Creates vertical headers or axes.
- Marks card: Controls mark type, color, size, label, detail, shape, and tooltip.
- Filters shelf: Limits the records included in the visualization.
- Pages shelf: Divides a view into a sequence of pages that can be reviewed one at a time.
For example, placing a category dimension on Rows and a sales measure on Columns commonly produces a bar chart. Moving those fields to different shelves changes the orientation and structure of the view.
Create a Basic Bar Chart in Tableau
A basic bar chart requires one categorical field and one numeric measure. The exact field names depend on your data source.
- Open a new worksheet after connecting to a data source.
- Drag a categorical dimension, such as Category, to the Rows shelf.
- Drag a numeric measure, such as Sales, to the Columns shelf.
- Confirm that the mark type on the Marks card is set to Bar.
- Use the sort controls when the bars need to be arranged by value.
- Drag another field to Color, Label, or Detail when the view requires an additional level of information.
Tableau normally aggregates numeric measures. For example, a Sales field may appear as SUM(Sales). You can change the aggregation by opening the field menu and choosing another calculation, such as Average, Minimum, Maximum, or Count.
Create a Nested Table with Year and Quarter
A nested table displays more than one level of headers. In this example, the basic view is modified to show quarters within each year.
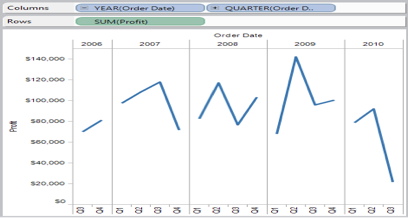
Start with a view that already contains Year of Order Date. Drill down in the date hierarchy by clicking the plus button on the right side of the Year field. Tableau adds the next available date level, such as Quarter.

You can also drag the Order Date field from the Data pane and drop it on the Columns shelf to the right of the Year (Order Date) field. Select Quarter as the date level when required.

The additional date dimension divides the view into separate panes for each year. Each year contains headers for its quarters. The result is called a nested table because the quarter headers are nested within the year headers.
Discrete and Continuous Fields in Tableau Views
Tableau fields can appear as discrete or continuous pills. This setting changes how Tableau displays the field in the view.
- Discrete fields: Create headers and divide the view into distinct categories or panes.
- Continuous fields: Create an axis that represents a range of values.
Date fields are a common example. A discrete year displays separate year headers, while a continuous date can display a time axis. Open the field menu on a shelf to switch between an available discrete or continuous representation.
Refine a Tableau View with the Marks Card
The Marks card controls how data marks are drawn. The available options vary with the selected mark type.
- Color: Separates marks by category or represents a continuous value with a color scale.
- Size: Changes mark size according to a measure or a fixed setting.
- Label: Displays field values directly on the marks.
- Detail: Adds granularity without necessarily changing the visible encoding.
- Tooltip: Controls the information shown when a user points to a mark.
- Shape: Uses different symbols for categories when the selected mark type supports shapes.
Add fields to the Marks card only when they improve interpretation. Too many colors, labels, or shapes can make a view difficult to read.
Filter and Sort Data in a Tableau Visualization
Filters restrict the records used in a worksheet. Drag a field to the Filters shelf, choose the values or range to include, and then show the filter control when viewers need to change it interactively.
Sorting controls the order of headers or marks. You can sort alphabetically, by a field, or by the aggregated measure displayed in the view. For a bar chart, sorting by the measure often makes comparisons easier.
Building Views in Tableau Automatically with Show Me
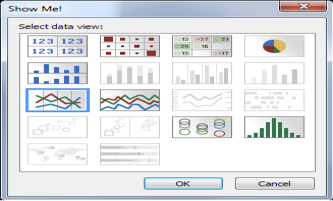
Show Me suggests visualization types based on the fields selected in the Data pane.
Instead of placing every field manually, select the dimensions and measures you want to analyze, open Show Me, and choose an enabled chart type.
- Select one or more fields in the Data pane. Hold Ctrl on Windows or Command on macOS to select multiple fields.
- Open the Show Me panel.
- Review the enabled chart types. Disabled chart types do not currently have the required combination of selected fields.
- Select a chart type to let Tableau place the fields and create the view.
- Review the resulting shelves, aggregation, mark type, filters, and labels.
- Adjust the automatically generated view when its defaults do not match the intended analysis.
Choose a Suitable Tableau Chart Type
The chart type should match the question being answered rather than simply the fields available.
- Bar chart: Compare values across categories.
- Line chart: Show change over an ordered time period.
- Text table: Display exact values in rows and columns.
- Scatter plot: Examine the relationship between two numeric measures.
- Map: Display data that contains recognized geographic fields.
- Highlight table: Compare values across two categorical dimensions using text and color.
Show Me can produce a valid chart, but it cannot determine the full analytical purpose of the worksheet. Check whether the chosen view communicates the intended comparison, trend, distribution, relationship, or geographic pattern.
Manual Tableau Views Compared with Show Me
| Method | How the view is built | When it is useful |
|---|---|---|
| Manual construction | Fields are dragged directly to shelves and cards. | Useful when you need precise control over field placement, aggregation, date level, and mark properties. |
| Show Me | Tableau selects an arrangement after you choose fields and a chart type. | Useful for quickly testing standard visualization forms and learning which fields a chart requires. |
Both methods use the same worksheet components. A view created with Show Me can be edited manually afterward, and a manually created view can be changed by selecting another chart in Show Me.
Save Tableau Views in a Workbook
After creating the required views, save the worksheets in a Tableau workbook. A workbook can contain worksheets, dashboards, stories, calculations, formatting, filters, and data connection information.
- Select File > Save or press Ctrl + S on your keyboard.
- Browse to the location where the workbook should be stored. By default, Tableau Desktop may use the Workbooks directory in the Tableau Repository.
- Specify a file name for the workbook.
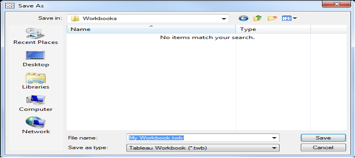
4. Specify the workbook file type.
The common Tableau workbook formats are:
- Tableau Workbook (.twb) – Stores workbook definitions, worksheets, dashboards, formatting, calculations, and data connection information. It does not normally embed the underlying local data files.
- Tableau Packaged Workbook (.twbx) – Packages the workbook with supported local resources, which may include local data files, extracts, background images, and custom geocoding files.
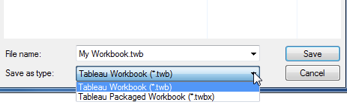
- When finished, click Save.
Use a packaged workbook when the recipient also needs supported local files required by the workbook. Before sharing either format, verify that the recipient has permission to access any external or published data sources referenced by the workbook.
Tableau Custom Views and Workbook Views Are Different
A worksheet view created in Tableau Desktop is part of the workbook. A custom view in a published Tableau environment is a saved state of an existing published view, such as a particular combination of filters, sorting, or selections.
Saving a custom view does not create a new worksheet in the original workbook. It preserves a personalized way of viewing published content, subject to the permissions and features available in the Tableau environment.
Common Problems When Building Tableau Views
- The chart type is unavailable in Show Me: Select the combination of dimensions and measures required by that chart.
- Tableau displays one mark instead of several: Add a dimension to Rows, Columns, Color, or Detail to divide the aggregated measure.
- A date appears at the wrong level: Open the date field menu and choose Year, Quarter, Month, Exact Date, or another required level.
- The view shows headers instead of an axis: Check whether the field is discrete. Convert it to continuous when an axis is required.
- Labels overlap: Reduce the number of labels, resize the view, filter the data, or use tooltips for secondary details.
- Totals differ from the source rows: Review the measure aggregation and any active filters.
Frequently Asked Questions About Building Tableau Views
What building blocks are needed to create a bar chart in Tableau?
A basic bar chart usually needs one categorical dimension and one numeric measure. Place the dimension on Rows and the measure on Columns, or reverse the shelves for a vertical orientation.
How do I create a visualization in Tableau?
Connect to a data source, open a worksheet, and place fields on the Rows shelf, Columns shelf, Marks card, and Filters shelf. You can also select fields and use Show Me to generate a standard chart arrangement.
What is the difference between building a Tableau view manually and using Show Me?
Manual construction gives you direct control over where each field is placed. Show Me automatically arranges selected fields for a chosen chart type. Views created by either method can be edited afterward.
How do I save a custom view in Tableau?
In a published Tableau environment, a custom view saves the current state of a view, such as its filters and sorting. The exact option depends on permissions and the Tableau site configuration. This is different from saving a Tableau Desktop workbook as a .twb or .twbx file.
Should I save a Tableau workbook as TWB or TWBX?
Use .twb when the workbook definition and data connections are sufficient. Use .twbx when supported local resources need to be packaged with the workbook for transfer or sharing.
Editorial QA Checklist for Tableau View Instructions
- Confirm that all instructions use current Tableau terms such as Data pane, Rows shelf, Columns shelf, Marks card, Filters shelf, and Show Me.
- Verify that the nested table steps produce Quarter headers within Year headers using the Order Date hierarchy.
- Check that bar chart guidance includes both a categorical dimension and a numeric measure.
- Confirm that discrete fields are described as headers and continuous fields as axes where applicable.
- Verify that the .twb and .twbx explanations clearly distinguish workbook definitions from packaged local resources.
- Ensure custom views are not described as new worksheets or replacements for saved workbook files.
Summary of Building Tableau Views
Tableau views can be built manually by placing dimensions and measures on worksheet shelves or automatically by selecting fields and choosing a chart type in Show Me. After creating the initial visualization, review field aggregation, date levels, discrete and continuous settings, mark properties, filters, and sorting. Save the completed worksheets in a .twb or .twbx workbook according to whether local resources need to be packaged with the file.