Dimensions and Measures in Tableau
Dimensions and Measures in Tableau: Welcome to Tableau Tutorial, in this tutorial we will learn about Dimensions and Measures in Tableau and what are Discrete fields and Continuous fields in Tableau.
What are Dimensions in Tableau?
A dimension is a field that can be considered an independent variable. Dimensions in Tableau produce headers when added to the Rows or Columns shelves in the view. By default, Tableau treats any field containing qualitative, categorical information as a dimension. However, in relational data sources, the actual definition of a Dimension is slightly more complex.
What are Measures in Tableau?
A measure is a field that is a dependent variable; that is, its value is a function of one or more dimensions. Measures typically produce axes when added to the rows or columns shelves. By default, Tableau treats any field containing numeric (quantitative) information as a measure.
Dimensions Vs Measures in Tableau
A measure can be aggregated for each value of the dimension. For example, if we want to calculate the Sum of “Sales” for every “State in India”. In this scenario, the State field is acting as a Dimension because you want to aggregate sales for each state. The values of Sales fields (Measures) are dependent on the State, So State is an independent field and Sales is a dependent field.
The values of Sales fields (Measures) are dependent on the State filed. This means that a measure is a function of other dimensions placed on the worksheet. In this case, the Sales field is acting as a measure because you want to aggregate the field for each state. But measures could also result in a non-numeric result.
Discrete Vs continuous
In Tableau, all relational fields containing numbers are treated as measures. However, you might decide that some of these fields should be treated as dimensions. In addition to dimensions and measures, each field in Tableau is categorized as either discrete or continuous. When a field is discrete it is shown in Blue color and when a field is continuous it is shown in Green color.
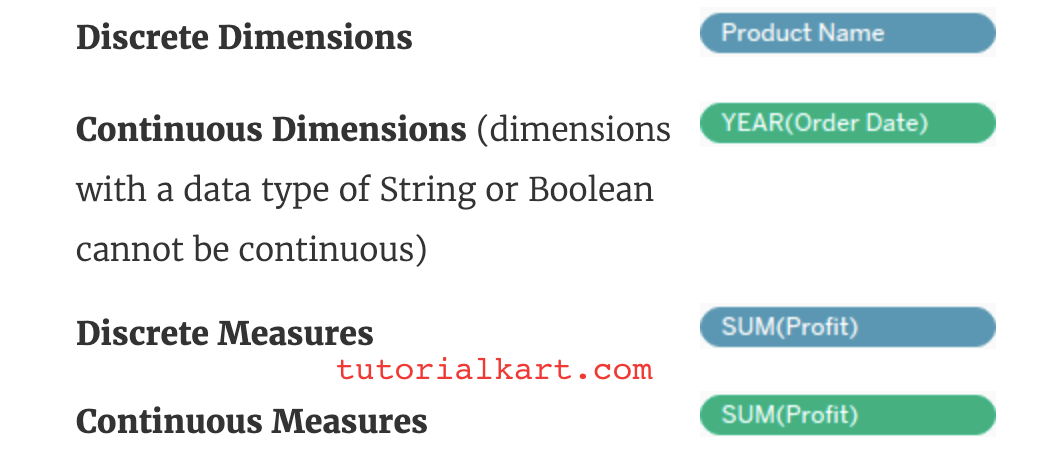
Whether a field is continuous or discrete is reflected in the color of the field’s data type icon. In the Data window, blue icons indicate discrete and green icons indicate continuous fields as shown above.
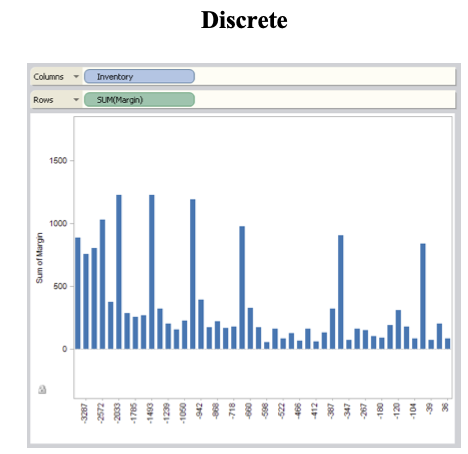
Discrete fields always result in headers being drawn whenever they are placed on the row or columns shelves as shown above. Each inventory value is drawn as a header. The Inventory field is colored blue on the Column shelf.
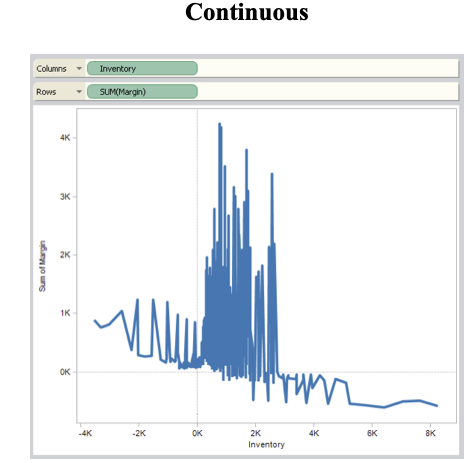
Continuous fields always result in axes when you add them to the view. Each inventory value is drawn along a continuous axis. The Inventory field is colored green on the Column shelf.