 TutorialKart.com
Tableau Environment Setup and Workspace Overview
A Tableau environment includes the software and services used to connect to data, build visualizations, organize worksheets, create dashboards, and share analytical content. For individual learning and local workbook development, the environment usually begins with Tableau Desktop.
Tableau can also be used with hosted or server-based environments for publishing and collaboration. The appropriate setup depends on whether you are developing workbooks locally, sharing content through an organization, or publishing visualizations publicly.
Main Components of a Tableau Environment
- Tableau Desktop: A desktop application used to connect to data, create worksheets, build dashboards, and prepare workbooks for sharing.
- Tableau Cloud: A hosted analytics environment used to publish, manage, and share Tableau content without maintaining the underlying server infrastructure.
- Tableau Server: A self-managed environment that organizations can deploy to publish and govern Tableau content within their own infrastructure.
- Tableau Public: A public platform for creating and sharing visualizations that are intended to be openly accessible.
This tutorial focuses on the Tableau Desktop environment and the main areas visible when you begin creating a workbook.
Download and Install Tableau Desktop
The Tableau Environment setup is the primary task that to be done before learning Tableau. In this process, we must download Tableau desktop, to download Tableau Desktop, you must register with details.
Before downloading Tableau Desktop, confirm that the computer meets the current operating-system and hardware requirements published for the selected Tableau release. Supported versions and requirements can change between releases.
- Open the Tableau Desktop download page.
- Select the installer for the operating system.
- Download and run the installation package.
- Review and accept the applicable license terms.
- Complete the installation wizard.
- Launch Tableau Desktop and follow the displayed activation or sign-in instructions.
After downloading the Tableau desktop, start the installation wizard and accept the license agreement. Licensing, trial availability, and activation options are displayed by Tableau during installation or first launch and may vary by product version and account.
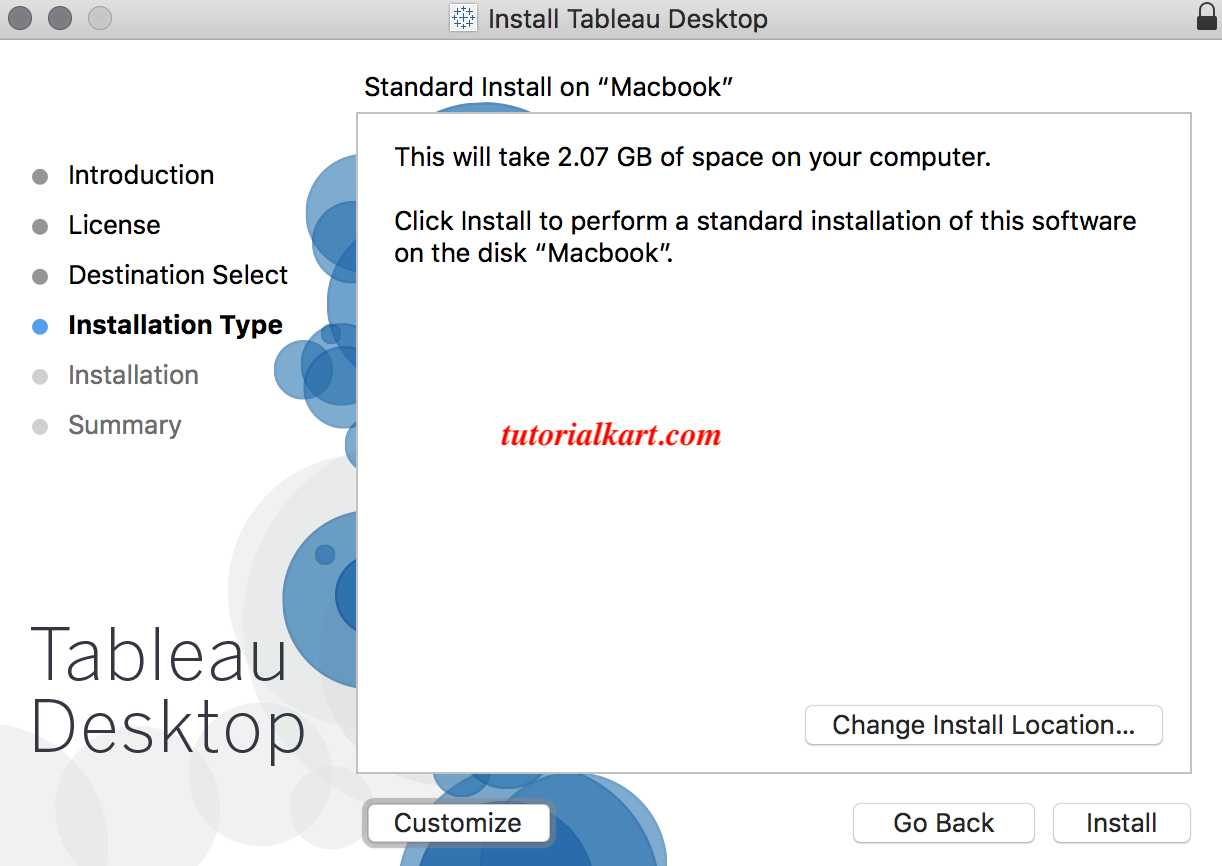
As shown above, we installed Tableau desktop on the Macbook.
Verify the Tableau Desktop Environment Installation
After installation, open Tableau Desktop from the operating system’s application menu, Launchpad, Applications folder, or desktop shortcut. A successful launch should display the Tableau start page.
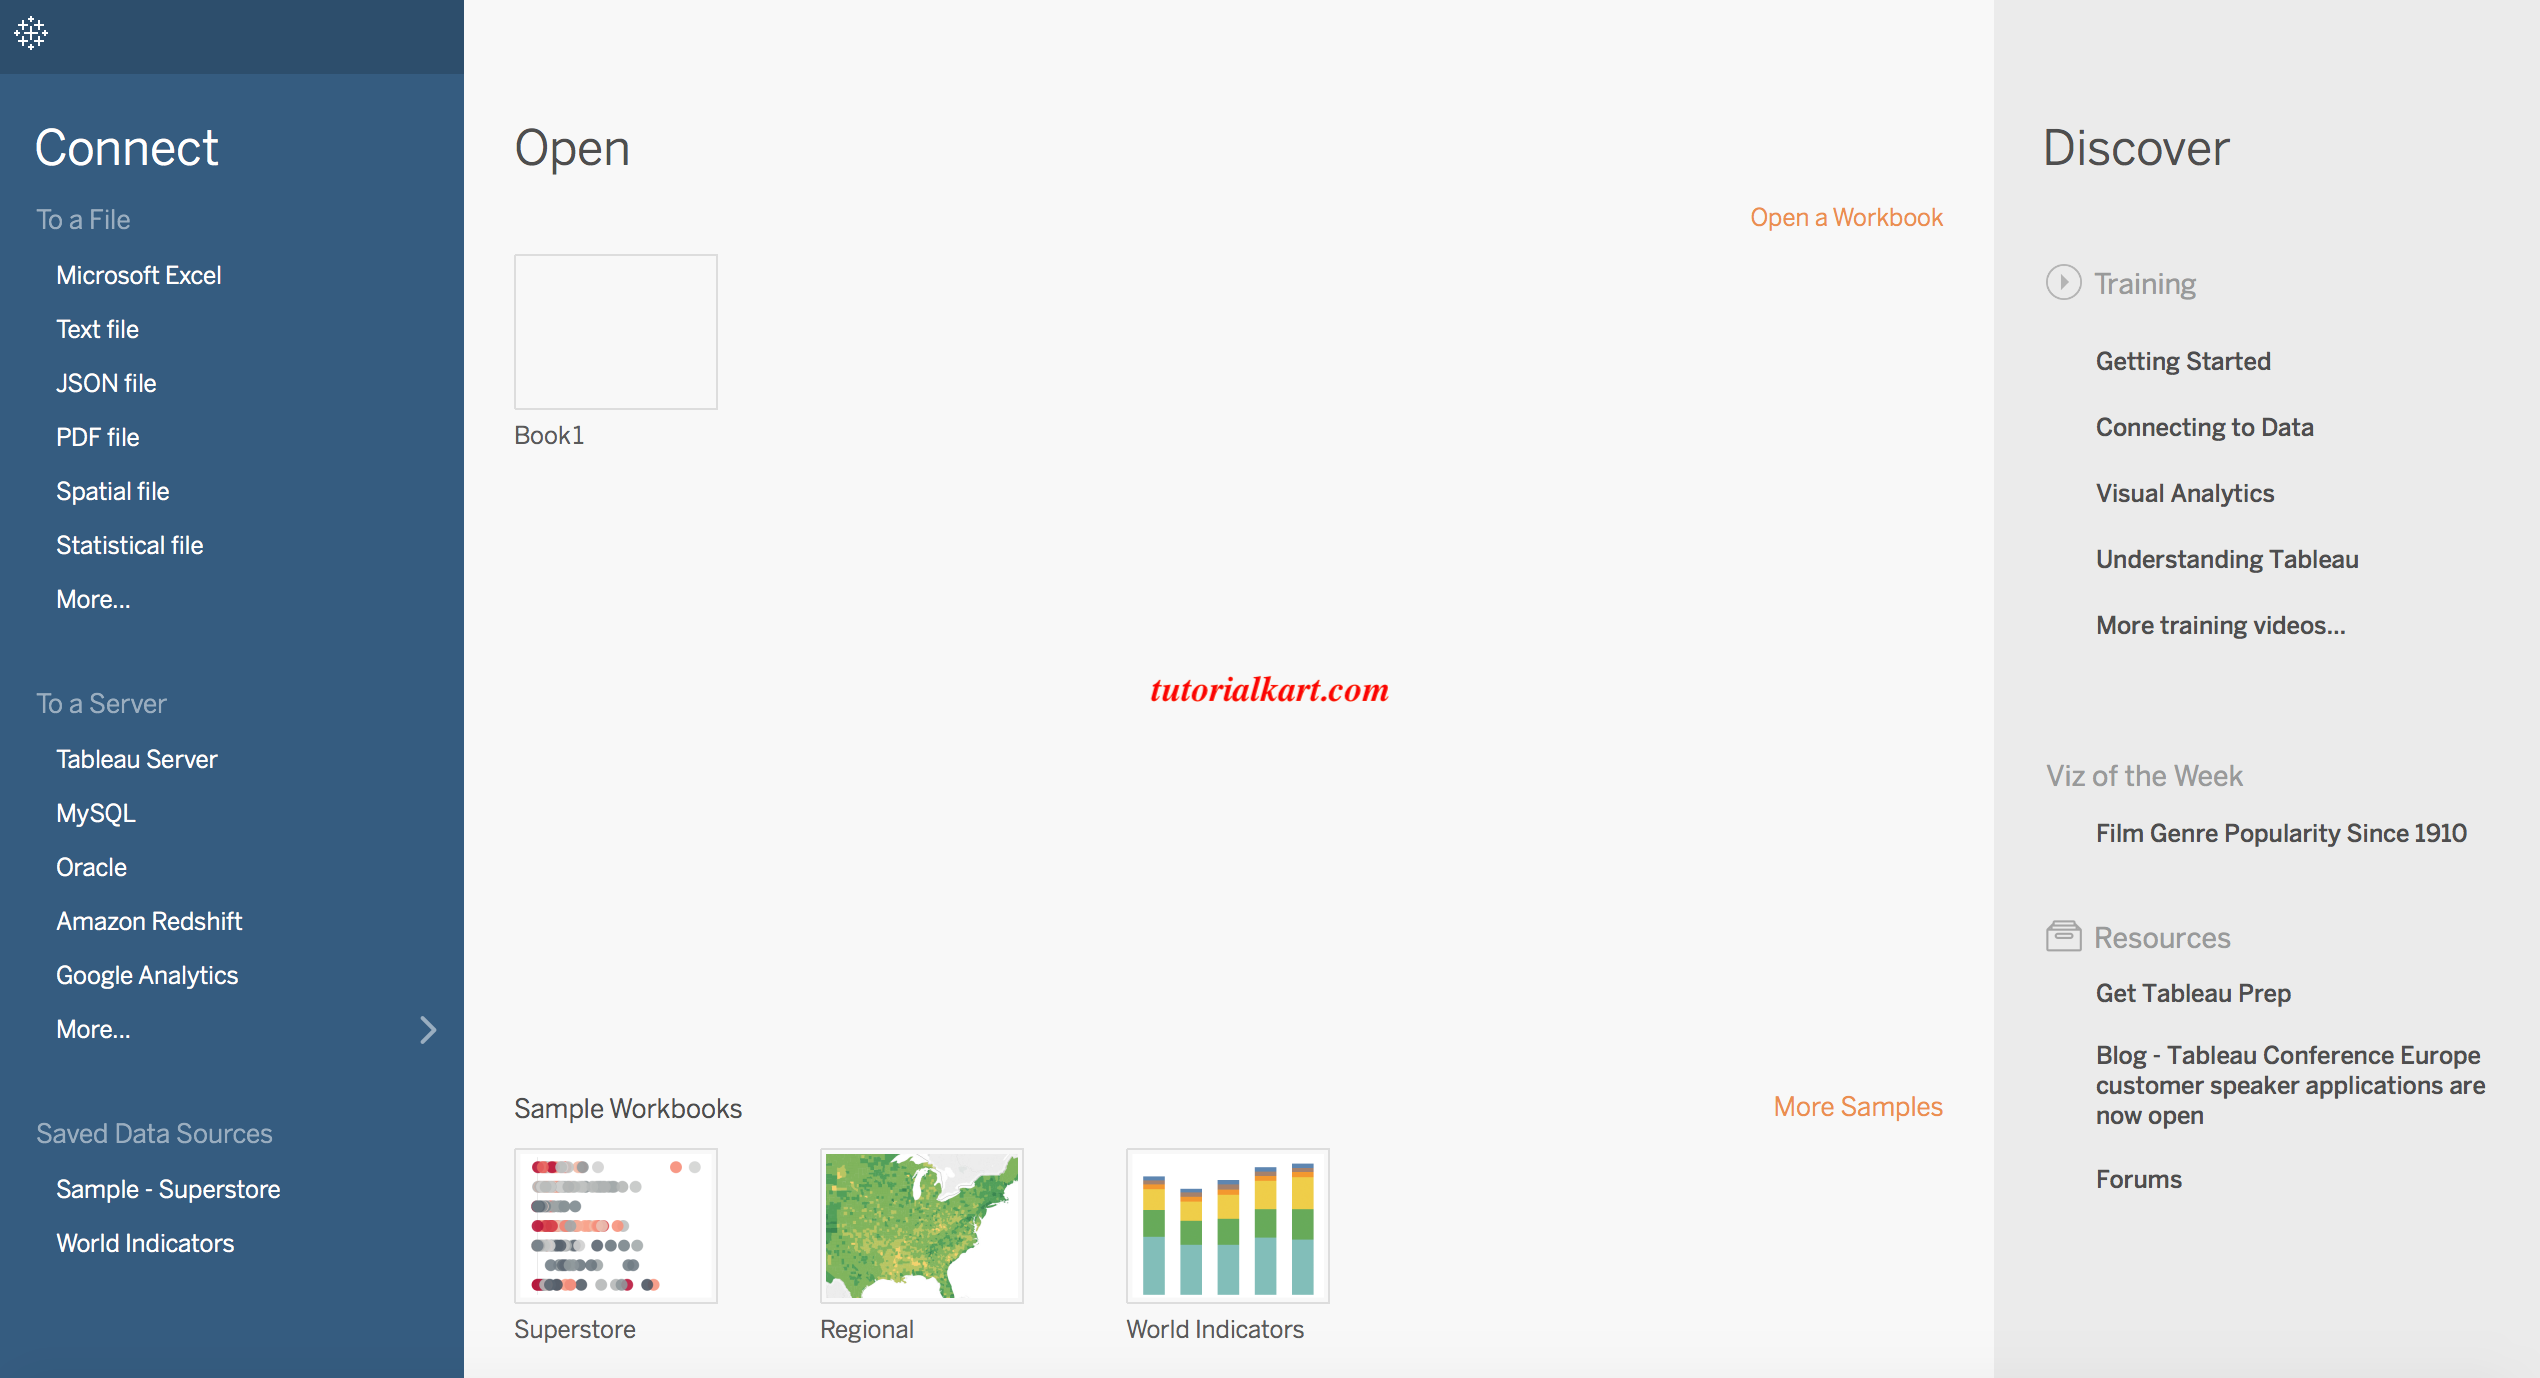
If Tableau does not open, check whether the installed release supports the operating system, confirm that the installation completed successfully, and verify that the user account has permission to run the application. Activation or sign-in issues should be handled using the options displayed in Tableau Desktop.
Tableau Desktop Start Page: Connect and Recent Workbooks
There are multiple ways to open Tableau, we can open directly from the desktop as it creates a shortcut icon. After opening the Tableau, the start page of the Tableau divided into two sections.
- Data section.
- Work Books section.
Data section: The data section lets any user connect to the new data source or quickly opens a saved connection. If you save any data source connection, by default all the data sources will get stored in the Tableau repository under the data sources folder.
The available connection options depend on the installed Tableau edition, operating system, drivers, and licensed connectors. Common connection categories include files, databases, and published data sources.
Work Books: Workbook section shows the images for the workbooks we have opened recently. When we are opening the Tableau for the first time the workbook section will be blank. As we create any new workbook and if you save it, then those are available in the workbook section.
- To create Workbook in Tableau, click on the file and select new.
Connect Tableau Desktop to a Data Source
To begin analysis, select a connector from the start page and provide the required file, server, or authentication details. Tableau then opens the Data Source page, where you can inspect tables, relationships, field names, and data types before creating a worksheet.
- Select a file or server connector from the Connect area.
- Choose the source file or enter the server connection details.
- Complete authentication when the source requires it.
- Add the required table or tables to the data model.
- Review field names and detected data types.
- Open a worksheet to begin building a view.
For database connections, the required driver may need to be installed separately. Connection availability also depends on the Tableau release and platform.
Tableau Workbook, Worksheet, Dashboard, and Story Structure
Tableau uses a workbook similar to Microsoft Excel sheets. A workbook contains multiple sheets which can either be a worksheet or a dashboard.
Workbook: A workbook is the main Tableau file used to organize data connections, worksheets, dashboards, and stories. Depending on how it is saved, a workbook may reference external data or include packaged local resources.
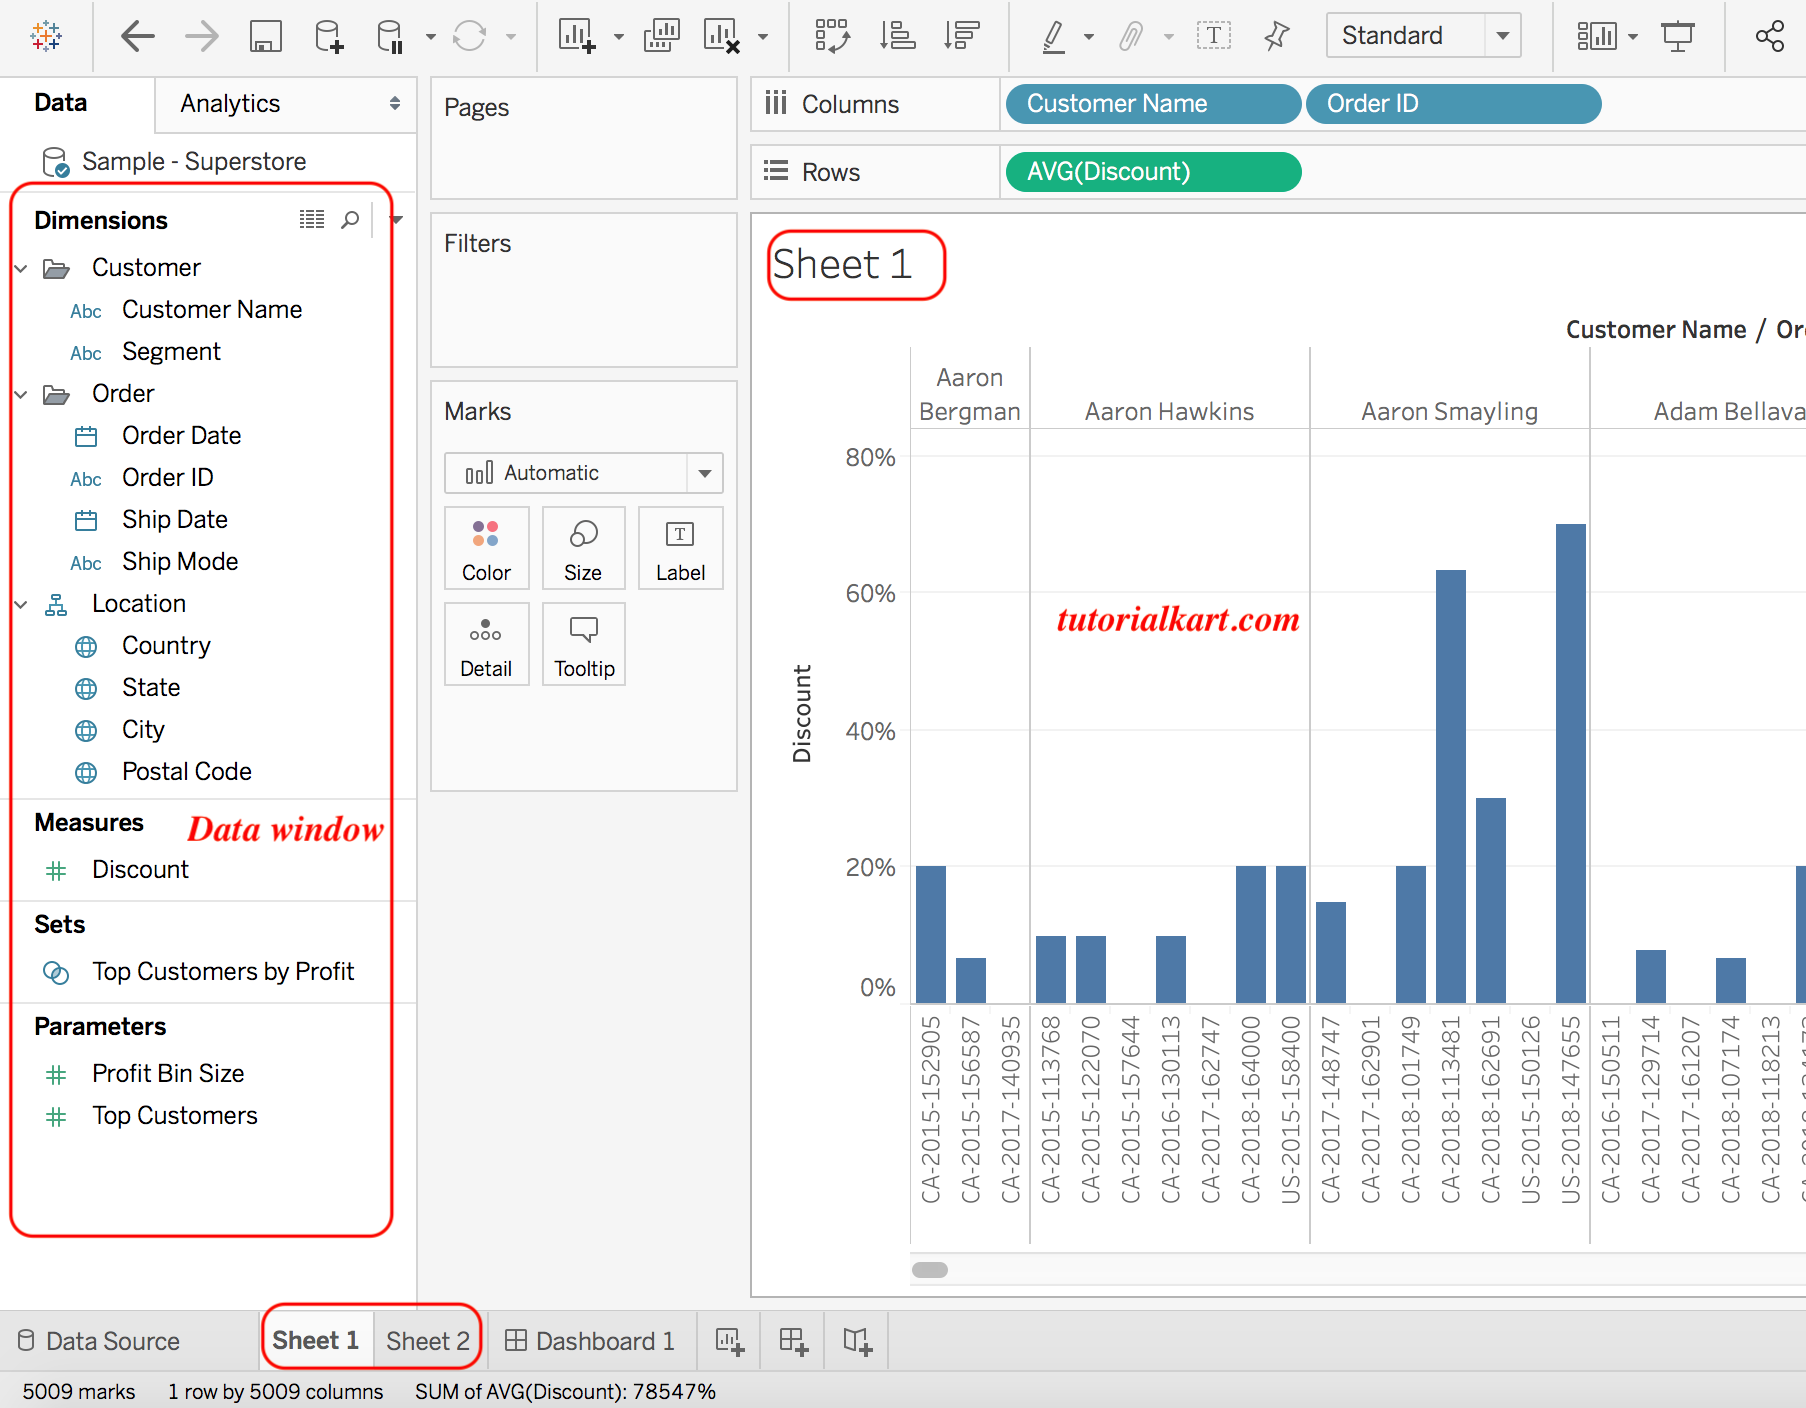
Worksheet: It is the smallest development object in the Tableau. A worksheet contains the single view of the data which contains shelves, legends, and data.
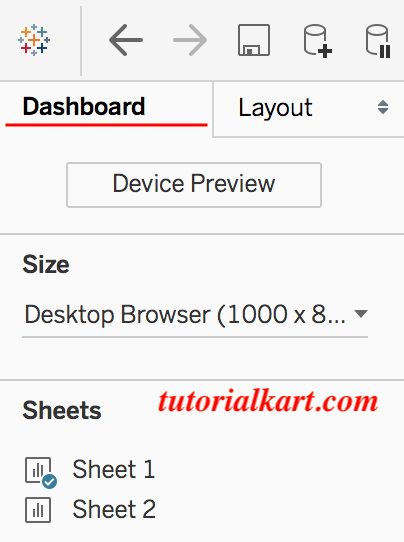
Dashboard: A dashboard is a collection of multiple worksheets. Within a Workbook, we can create new sheets, we can duplicate sheets, we can delete sheets, even we can hide and show sheets.
Story: A story presents a sequence of worksheets or dashboards as ordered story points. It can be used to guide readers through a set of findings or stages of analysis.
Tableau Worksheet Environment and Authoring Areas
After opening a worksheet, Tableau displays several authoring areas that work together to build a visualization.
- Data pane: Lists fields from the connected data source and may also include parameters, sets, groups, folders, and calculated fields.
- Analytics pane: Provides analytical objects that can be added to a view, depending on the selected visualization and available fields.
- Columns shelf: Defines fields placed across the horizontal direction of the view.
- Rows shelf: Defines fields placed across the vertical direction of the view.
- Marks card: Controls properties such as mark type, color, size, label, detail, tooltip, shape, and path when applicable.
- Filters shelf: Holds fields used to restrict the data displayed in the worksheet.
- Pages shelf: Divides a view into a sequence based on the selected field when the feature is applicable.
- View or canvas: Displays the visualization created from the selected fields and settings.
- Show Me: Suggests visualization types based on the fields currently selected.
- Sheet tabs: Provide access to worksheets, dashboards, and stories in the workbook.
Tableau Environment Data Pane
In the Tableau workspace, the first part is called as Data window. The data window contains dimensions, measures, sets, and parameters as shown below.
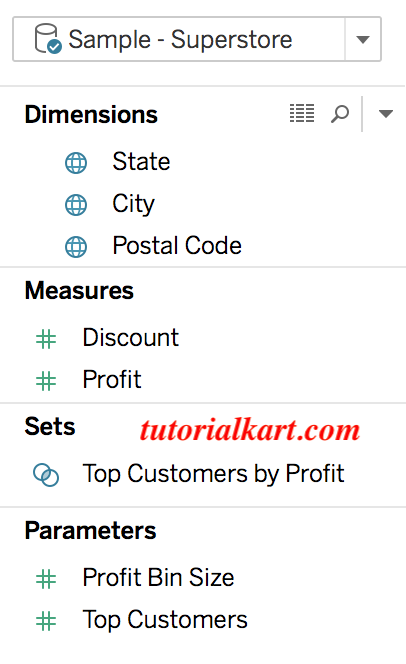
The above data window in Tableau will be available on the left side of the Workspace.
Dimensions and Measures in the Tableau Data Pane
Fields in the Data pane are commonly used as dimensions or measures. Their role affects how Tableau groups, aggregates, and displays the data.
- Dimensions: Fields generally used to categorize, segment, label, or define the level of detail in a view. Examples include product name, region, customer ID, and order date.
- Measures: Fields generally used for numeric analysis and aggregation. Examples include sales, profit, quantity, and duration.
- Discrete fields: Produce separate headers or categories and are commonly displayed as blue pills in the Tableau interface.
- Continuous fields: Produce an axis or continuous range and are commonly displayed as green pills.
A field’s data type, role, and discrete or continuous setting can be changed when the default interpretation does not match the intended analysis.
Create a First View in the Tableau Desktop Environment
After connecting to data, a simple view can be created by placing a category field and a numeric field on the worksheet shelves.
- Open a new worksheet.
- Drag a categorical field, such as Region, to the Rows shelf.
- Drag a numeric field, such as Sales, to the Columns shelf.
- Use the Marks card to adjust labels, colors, size, or mark type.
- Add a field to the Filters shelf when only part of the data should be shown.
- Save the workbook using an appropriate name and location.
Tableau aggregates measures by default in many views. The aggregation shown in the field pill, such as SUM or AVG, should be checked before interpreting the result.
Tableau Desktop, Tableau Cloud, Server, and Public Differences
| Tableau product | Primary role in the environment | Typical use |
|---|---|---|
| Tableau Desktop | Workbook authoring and local analysis | Connect to data and create worksheets, dashboards, and stories |
| Tableau Cloud | Hosted publishing and collaboration | Share and manage Tableau content in a cloud-hosted environment |
| Tableau Server | Self-managed publishing and governance | Host Tableau content within infrastructure managed by an organization |
| Tableau Public | Public visualization publishing | Share visualizations that are suitable for open public access |
Do not publish confidential, private, or restricted information to a public environment. Follow the organization’s data governance and access-control requirements when using Tableau Cloud or Tableau Server.
Common Tableau Environment Setup Problems
- Unsupported operating system: Confirm that the Tableau release supports the installed operating-system version.
- Missing database driver: Install the driver required by the selected database connector.
- Activation or sign-in failure: Check account access, license assignment, network connectivity, and the activation instructions displayed by Tableau.
- Unable to reach a server: Verify the server address, port, VPN connection, proxy settings, firewall rules, and credentials.
- Incorrect field types: Review detected data types on the Data Source page before building calculations or visualizations.
- Slow workbook performance: Reduce unnecessary fields, review filters and joins, limit expensive calculations, and evaluate whether the connection mode is appropriate.
- Blank recent-workbook area: The recent list may be empty on a new installation or when no workbook has yet been saved and reopened.
Frequently Asked Questions about the Tableau Environment
What is a Tableau environment?
A Tableau environment is the combination of Tableau software, data connections, workbooks, user access, and publishing services used to create and share visual analysis. It may consist only of Tableau Desktop or include Tableau Cloud, Tableau Server, or Tableau Public.
What is Tableau Desktop used for?
Tableau Desktop is used to connect to supported data sources, prepare a data model, create worksheets, combine views into dashboards, build stories, save workbooks, and publish content to a compatible Tableau environment.
What environments are supported by Tableau Desktop?
Supported operating systems, virtual environments, and hardware requirements depend on the Tableau release. Check the current Tableau technical specifications before installation rather than relying on requirements for an older version.
What is the difference between Tableau Cloud and Tableau Server?
Tableau Cloud is hosted and maintained as a cloud service, while Tableau Server is deployed and managed by the organization using it. Both can be used to publish, govern, and share Tableau content, but their administration and infrastructure responsibilities differ.
Can Tableau Desktop connect to both files and databases?
Tableau Desktop supports connections to various file and server-based data sources. The exact connectors available depend on the Tableau edition, release, operating system, installed drivers, and licensing.
Editorial QA Checklist for the Tableau Environment Tutorial
- Verify that the existing Tableau Desktop download link still resolves to the intended official download workflow.
- Confirm that installation instructions do not state a fixed trial duration unless the current Tableau licensing page supports it.
- Check that screenshots are identified as examples from an older interface and do not imply that every current release has an identical layout.
- Verify current operating-system and hardware requirements against Tableau’s technical specifications before publishing an update.
- Confirm that Tableau Desktop, Tableau Cloud, Tableau Server, and Tableau Public are described according to their distinct authoring, hosting, and sharing roles.
- Check that the Data pane explanation distinguishes dimensions, measures, discrete fields, and continuous fields correctly.
- Ensure that public publishing guidance warns against uploading confidential or restricted data.
- Test the first-view instructions with a currently supported Tableau Desktop release and a sample data source.
Tableau Environment Setup Summary
A basic Tableau environment starts with installing Tableau Desktop, verifying that the application launches, connecting to a supported data source, and understanding the workbook workspace. The main authoring objects are worksheets, dashboards, and stories, while the Data pane, shelves, Marks card, filters, and view canvas provide the controls used to build an analysis. Tableau Cloud, Tableau Server, and Tableau Public provide different options for publishing and sharing completed content.