Draw Pie Chart in R Programming Language
A pie chart in R is a circular chart where each slice shows the proportion of one category in the total. In base R, the main function for a 2D pie chart is pie(). For a 3D-style pie chart, the commonly used function is pie3D() from the plotrix package.
This tutorial explains how to draw a pie chart in R programming language, customize labels, colors, stripe patterns, borders, start angle, and also create a 3D pie chart when required.
R Pie Chart Tutorial Sections
- 2D Pie Chart using
pie() - 3D Pie Chart using
pie3D()- Syntax of R pie3D() function
- Example for pie3D()
- Best practices for pie charts in R
- R pie chart FAQs
Syntax of R pie() Function
The base R pie() function takes a numeric vector and draws each value as a slice. The size of each slice is calculated from its value divided by the sum of all values.
pie(x, labels = NULL, edges = 200, radius = 0.8,
 clockwise = FALSE, init.angle = 0,
 density = NULL, angle = 0, col = NULL, border = NULL,
 lty = NULL, main = NULL, …)
where
- x [mandatory] is a numerical vector with values >=0. Each values decides the proportion of circle.
- labels is a character vector. They are names for the slices.
- edges the circular outline of the pie is approximated by a polygon with this many edges.
- radius of the circle in pie chart.
- clockwise represents the logical indicating if slices are drawn clockwise or counter clockwise. counter clockwise is default. {TRUE,FALSE}
- init.angle is the initial angle(in degrees) to start with for drawing sectors. [0,360]
- density of shading lines, in lines per inch
- angle is the slope of shading lines in degrees (counter-clockwise).
- col is a vector of colors to be used in filling or shading the slices.
- border, lty – arguments passed to polygon which draws each slice.
- main is an overall title for the plot.
- … is graphical parameters can be given as arguments to pie. They will affect the main title and labels only.
A short practical syntax for most R pie charts is shown below.
pie(x = values, labels = slice_names, col = colors, main = "Chart title")Prepare Values and Labels for an R Pie Chart
Before calling pie(), make sure the numeric vector and the label vector have the same length. The numeric values should be non-negative. If you want the labels to show percentages, calculate them from the same vector used for the chart.
values = c(4, 1, 3, 1, 2)
slice_names = c("breakfast", "brunch", "lunch", "snacks", "dinner")

percentages = round(values / sum(values) * 100, 1)
labels_with_percent = paste(slice_names, percentages, "%")
For the data above, the sum is 4 + 1 + 3 + 1 + 2 = 11. The breakfast slice is therefore 4 / 11 × 100 = 36.4% after rounding to one decimal place.
Example 1 – Simple Pie Chart
In this example, we will write an R program, to draw a basic pie chart.
example.R – R Program
# Data Pie chart
x = c(4, 1, 3, 1, 2)
labels = c('breakfast', 'brunch', 'lunch', 'snacks', 'dinner')
colors = c('#4286f4','#bb3af2','#ed2f52','#efc023','#ea7441')

# Give the chart file a name.
png(file = "diet.png")

# Plot the chart.
pie(x, labels, main='Daily Diet Plan', col=colors, init.angle=180, clockwise=TRUE)

# Save the file.
dev.off()
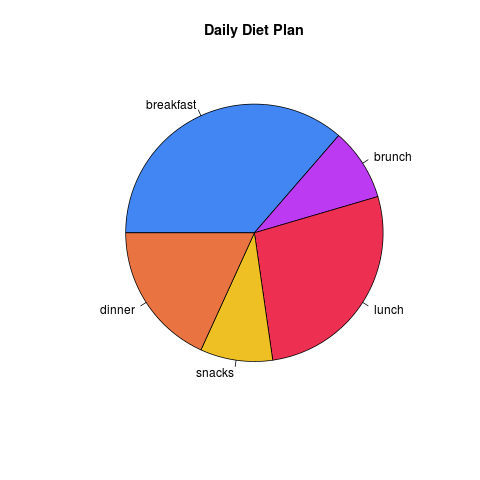
When the above program is run, following pie chart is created at the location of your Rscript.
Here, png(file = "diet.png") opens a PNG graphics device, pie() draws the chart into that device, and dev.off() closes the device so that the image file is written properly.
Example 2 – R Pie Chart with Percentage Labels
Category names alone may not show the exact proportion clearly. The following R program adds percentage values to the pie chart labels.
example.R – R Program
# Data for Pie chart
x = c(4, 1, 3, 1, 2)
meal_names = c("breakfast", "brunch", "lunch", "snacks", "dinner")
colors = c("#4286f4", "#bb3af2", "#ed2f52", "#efc023", "#ea7441")

# Create percentage labels
percentages = round(x / sum(x) * 100, 1)
labels = paste(meal_names, percentages, "%")

# Save pie chart as PNG
png(file = "diet-percentages.png")

pie(x, labels = labels, main = "Daily Diet Plan", col = colors, init.angle = 180, clockwise = TRUE)

dev.off()
The important step is x / sum(x) * 100. It converts every value into its percentage contribution to the total.
Example 3 – Pie Chart with Striped Lines
In this example, we will write an R program to draw a pie chart with striped lines in the sector area.
example.R – R Program
# Draw Pie Chart in R
# Data Pie chart
x = c(4, 1, 3, 1, 2)
labels = c('breakfast', 'brunch', 'lunch', 'snacks', 'dinner')
colors = c('#4286f4','#bb3af2','#ed2f52','#efc023','#ea7441')

# Give the chart file a name.
png(file = "diet.png")

# Plot the chart.
pie(x, labels, main='Daily Diet Plan',density=30 ,col=colors, angle=45)

# Save the file.
dev.off()
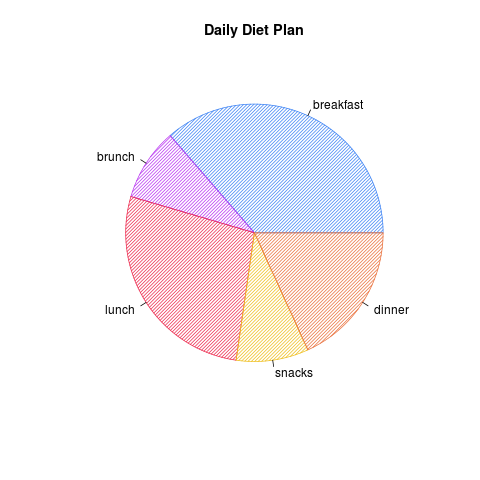
The density argument controls the number of shading lines per inch. The angle argument controls the slope of those lines. This is useful when the chart is printed without dependable color reproduction.
Example 4 – Pie Chart with Edged Sectors
In this example, we will draw a Pie Chart with edged sectors. Instead of circular outer edges, we get straight lines.
example.R – R Program
# Draw Pie Chart in R
# Data Pie chart
x = c(4, 1, 3, 1, 2)
labels = c('breakfast', 'brunch', 'lunch', 'snacks', 'dinner')
colors = c('#4286f4','#bb3af2','#ed2f52','#efc023','#ea7441')

# Give the chart file a name.
png(file = "diet.png")

# Plot the chart.
pie(x, labels, main='Daily Diet Plan',edges=1 ,col=colors)

# Save the file.
dev.off()
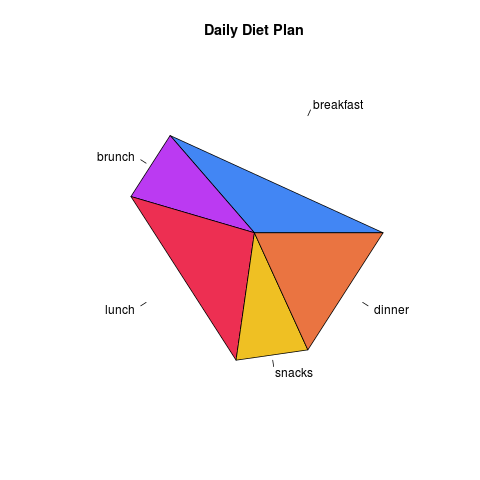
The edges argument decides how many straight-line segments are used to approximate the circle. A small value gives a visibly angular boundary, while the default value gives a smooth circular appearance.
Syntax of R pie3D() Function
plotrix library is required to use it in an Rscript.
The pie3D() function is not part of base R. Install and load the plotrix package before using it.
install.packages("plotrix")
library(plotrix)pie3D(x,edges=NA,radius=1,height=0.1,theta=pi/6,start=0,border=par("fg"),
col=NULL,labels=NULL,labelpos=NULL,labelcol=par("fg"),labelcex=1.5,
sector.order=NULL,explode=0,shade=0.8,mar=c(4,4,4,4),pty="s",...)
x [mandatory] is a numerical vector with values >=0. Each values decides the proportion of circle.where
- labels is a character vector. They are names for the slices.
- radius of the circle in pie chart.
- col is a vector of colors to be used in filling or shading the slices.
- main is an overall title for the plot.
- explode is the amount by which sectors are exploded
- … extra arguments
Some commonly adjusted pie3D() arguments are height for the thickness effect, explode for separating slices, start for the starting position, and shade for the shading effect.
Example 1 – Simple 3D Pie Chart in R
In this example, we will use pie3D() function, and draw a 3D Pie Diagram.
example.R – R Program
# Draw Pie Chart in R
# Get the library.
library(plotrix)

# Data for Pie chart
x = c(4, 1, 3, 1, 2)
labels = c('breakfast', 'brunch', 'lunch', 'snacks', 'dinner')
colors = c('#4286f4','#bb3af2','#ed2f52','#efc023','#ea7441')

# Give the chart file a name.
png(file = "diet3d.png")

# Plot the chart.
pie3D(x, labels=labels, explode=0.1, height=0.05, main='Daily Diet Plan', col=colors)

# Save the file.
dev.off()
When the above program is run, following pie chart is created at the location of your Rscript.
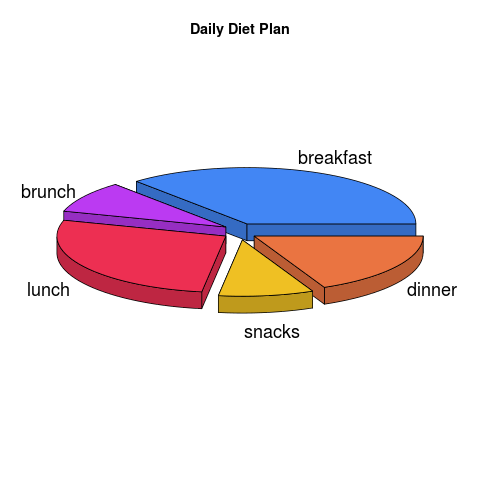
A 3D pie chart can be useful for presentation-style output, but it may make slice comparisons less precise because of perspective and shading. For data analysis, a simple 2D pie chart is usually easier to read.
Best Practices for Drawing Pie Charts in R
- Use a pie chart when you need to show parts of one whole, not unrelated values.
- Keep the number of slices small. Too many categories make labels difficult to read.
- Use percentage labels when the exact share matters.
- Use the same data vector for both the chart and the percentage calculations.
- Do not use negative values in
x. A pie chart represents non-negative parts of a total. - Check that the labels vector and the values vector have the same length before plotting.
Common R Pie Chart Errors and Fixes
| Issue in R pie chart | Likely reason | Fix |
|---|---|---|
| Labels are missing | labels is not supplied or has empty values | Create a character vector with one label for each value. |
| Chart file is not saved | dev.off() was not called after png() | Call dev.off() after the plotting function. |
| Percentages do not match slices | Percentages were calculated from a different vector | Use round(x / sum(x) * 100, 1) for the same x. |
pie3D() not found | plotrix package is not loaded | Run library(plotrix) after installing the package. |
FAQs on Pie Chart in R Programming Language
How to draw pie chart in R programming language?
Use the base R pie() function. Create a numeric vector for slice values, create a label vector for category names, and call pie(values, labels = labels). You can add main, col, init.angle, and clockwise to customize the chart.
Which R function is used to create a 2D pie chart?
The base R function pie() is used to create a 2D pie chart. It is available without installing any extra package.
How do I add percentages to labels in an R pie chart?
Calculate percentages with round(x / sum(x) * 100, 1) and combine them with category names using paste(). Then pass the combined labels to the labels argument of pie().
How do I save an R pie chart as a PNG file?
Call png(file = "filename.png") before pie(), draw the chart, and then call dev.off(). The dev.off() call closes the graphics device and writes the file.
How do I create a 3D pie chart in R?
Install and load the plotrix package, then use pie3D(). For example, pie3D(x, labels = labels, col = colors) creates a 3D-style pie chart from the numeric vector x.
Editorial QA Checklist for This R Pie Chart Tutorial
- Confirm that every R pie chart code block uses a numeric vector with non-negative values.
- Confirm that each label vector has the same number of elements as the data vector.
- Check that every PNG example includes both
png()anddev.off(). - Verify that
pie3D()examples mention the requiredplotrixpackage. - Ensure any new R code block uses the correct PrismJS class such as
language-rorlanguage-r syntax.
R Pie Chart Tutorial Summary
In this R Tutorial, we have learnt to draw Pie Chart in R programming language in 2D and 3D. The base R pie() function is enough for standard pie charts, while pie3D() from plotrix can be used when a 3D-style chart is specifically required.