 TutorialKart.com
A line graph in R is used to show how one numeric variable changes with another numeric variable, usually across time, sequence, distance, or ordered observations. In base R, the most direct way to draw a line graph is to use the plot() function with type='l' for lines or type='b' for both points and lines.
Plot a Line Graph in R Using plot()
We shall learn to plot a line graph in R programming language with the help of plot() function. The examples below use base R, so no additional package is required. You will see how to plot a simple line, show both points and line segments, color the line, show only points, create a stair-step graph, add a line on a scatterplot, and draw more than one line on the same graph.
- Syntax of Plot Function
- Line graph type values in R plot()
- Examples
- R line graph FAQ
- R line graph QA checklist
Syntax of plot() function for line graphs in R
plot(x, y, ...)where
- x is any R object with a plot method. Ex : numeric vector
- y is any R object with a plot method. Ex : numeric vector
- … is the extra arguments that could be provided, which may contain any of the following
- type – type could be any of the below values
- ‘p’ – points
- ‘l’ – lines
- ‘b’ – both points and lines
- ‘c’ – for the lines part alone of both points and lines
- ‘o’ – for both points and lines overplotted
- ‘h’ – generates kind of histogram view
- ‘s’ – for stair step look
- ‘S’ – other steps
- ‘n’ – no plotting
- main is the main title for the plot
- sub is the sub title for the plot
- xlab is the x label i.e., title for x-axis
- ylab is the y label i.e., title for y-axis
- asp is the aspect ratio whose value should be given by y/x
- lwd is the line width
- pch is the point character. There are 25 symbols to choose from including alphabetic characters
- col gives the color to points and line
- type – type could be any of the below values
For a line graph, x and y should usually have the same length. The first value of x is paired with the first value of y, the second value of x is paired with the second value of y, and so on. R then connects those points in the order given by the vectors.
Line graph type values in R plot()
The type argument decides whether R draws points, lines, both, or steps. The following values are most useful while plotting line graphs in R.
| type value | What R draws | When to use it |
|---|---|---|
type='l' | Line only | Use for a clean trend line without markers. |
type='b' | Both points and lines | Use when each observation should be visible. |
type='p' | Points only | Use for a scatter-style display of the same data. |
type='o' | Overplotted points and lines | Use when points should appear directly on the line. |
type='s' | Stair-step line | Use for values that remain constant until the next change. |
Example 1 : Line Graph
In this example, we will use plot() and draw a line graph.
example.R – R Program
# R program to plot line graph
x = c(1,2,3,4,5,6,7,8,9,10,11)
y = c(22,13,5,9,25,22,26,1,9,10,2)

# plot function
# except x,y ; rest are optional
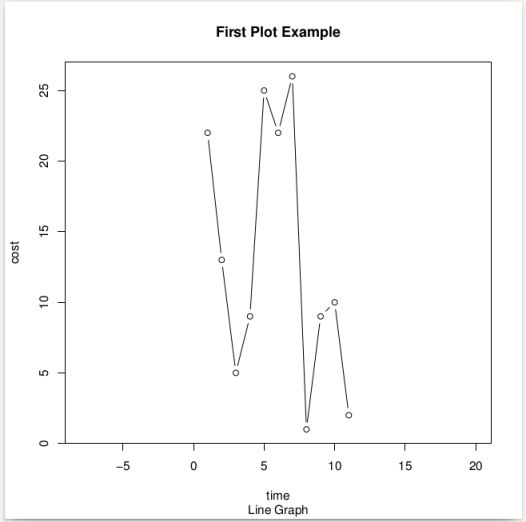
plot(x, y, type='b', main='First Plot Example', sub='Line Graph', xlab='time', ylab='cost', asp=1)
When this R program is run in RStudio, the graph is shown in the Plots pane. When it is run in a non-interactive script with a graphics device configured, the output may be written to that device, such as a PDF or image file. The plotted graph connects each x and y pair and also displays a point marker because type='b' is used.
Example 2 : Line, No points, Colored line
In this example, we will use plot() and draw a line graph. We will draw the line graph with a colored line and no points.
example.R – R Program
# R program to plot line graph
x = c(1,2,3,4,5,6,7,8,9,10,11)
y = c(22,13,5,9,25,22,26,1,9,10,2)

# plot function
# except x,y ; rest are optional
plot(x, y, type='l', col='#ff0000')
Output Line Graph Plot
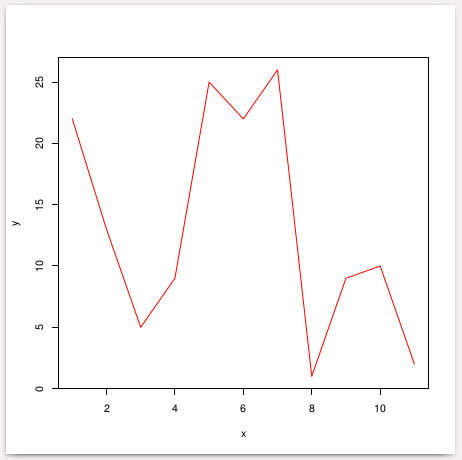
Here, type='l' draws only the line. The value of col can be a named R color such as 'red' or a hexadecimal color value such as '#ff0000'.
Example 3 : Points, No Line, Colored points
In this example, we will use plot() and draw a line graph. We will draw the line graph with colored points and no line.
example.R – R Program
# R program to plot line graph
x = c(1,2,3,4,5,6,7,8,9,10,11)
y = c(22,13,5,9,25,22,26,1,9,10,2)

# plot function
# except x,y ; rest are optional
plot(x, y, type='p', col='#0000ff')
Output Point Graph Plot
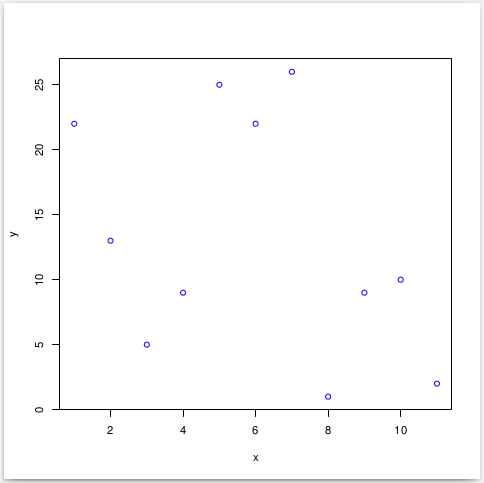
This example uses the same x and y values but displays only the point markers. It is useful when you want to inspect the data points before deciding whether a connected line is meaningful.
Example 4 : Stair Step Graph
In this example, we will use plot() and draw a stair step graph.
example.R – R Program
# R program to plot stair graph
x = c(1,2,3,4,5,6,7,8,9,10,11)
y = c(22,13,5,9,25,22,26,1,9,10,2)

# plot function
plot(x, y, type='s', col='#0000ff')
Output Stair Graph Plot
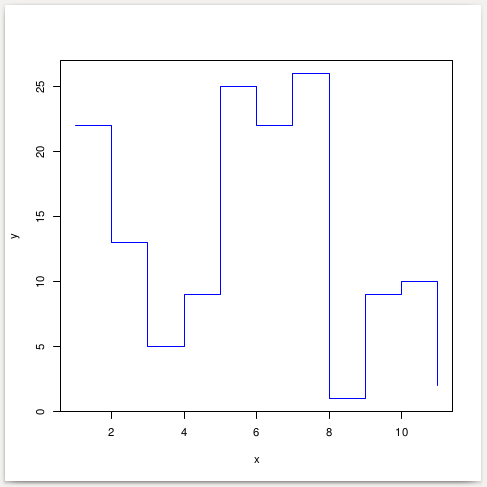
A stair-step line is useful when the value should remain unchanged until the next observation. For example, it can represent a rate, level, or status that changes only at specific points.
Add a line to a scatterplot in R using lines()
To plot a line on a scatterplot in R, first create the points with plot(), and then add a connected line with lines(). This approach is useful when you want to start with point observations and then overlay a line using the same or another series.
example.R – R Program
# R program to add a line on a scatterplot
x = c(1, 2, 3, 4, 5, 6)
y = c(4, 7, 9, 8, 12, 15)

# Draw points first
plot(x, y, type='p', main='Scatterplot with Line', xlab='x values', ylab='y values')

# Add a line through the same points
lines(x, y, col='blue', lwd=2)
The plot() call creates the graph area and draws points. The lines() call adds line segments to the existing plot instead of creating a new plot.
Plot multiple lines in one R line graph
To draw multiple lines in the same R graph, create the first line with plot() and then add the next line with lines(). Use ylim to make sure the y-axis range can show both series.
example.R – R Program
# R program to plot multiple lines
x = c(1, 2, 3, 4, 5)
sales_a = c(12, 15, 14, 18, 21)
sales_b = c(10, 13, 16, 17, 19)

# Draw the first line
plot(x, sales_a, type='l', col='blue', lwd=2,
     ylim=range(c(sales_a, sales_b)),
     main='Two Line Graphs in R',
     xlab='Month',
     ylab='Sales')

# Add the second line
lines(x, sales_b, col='red', lwd=2)

# Add a legend
legend('topleft', legend=c('Sales A', 'Sales B'),
       col=c('blue', 'red'), lwd=2)
In this example, ylim=range(c(sales_a, sales_b)) calculates a y-axis range that includes both lines. Without this, one line may be partly outside the visible graph area if its values are larger or smaller than the first series.
Save an R line graph to a PNG file
When you need a line graph as an image file, open a graphics device such as png(), run the plotting code, and close the device with dev.off().
example.R – R Program
# R program to save a line graph as PNG
x = c(1, 2, 3, 4, 5)
y = c(8, 11, 13, 12, 16)

png('line-graph-r.png', width=800, height=500)

plot(x, y, type='b',
     main='Line Graph Saved from R',
     xlab='Observation',
     ylab='Value',
     col='blue',
     lwd=2,
     pch=19)

dev.off()
The file line-graph-r.png is saved in the current working directory. You can check the current directory in R with getwd() and change it with setwd() if required.
Common mistakes while plotting a line graph in R
- Different vector lengths:
xandyshould usually contain the same number of values. - Unordered x values: R connects points in the order supplied. Sort the data first if the line should follow increasing x values.
- Wrong graph type: Use
type='l'for only a line,type='b'for both points and lines, andtype='p'for only points. - Missing axis labels: Add
xlabandylabso the graph can be understood without reading the code. - Second line not visible: Set
ylimbefore adding more lines withlines().
R line graph FAQ
How to plot a line graph in R?
Use plot(x, y, type='l') to plot a line graph in R. The vector x supplies the x-axis values, and the vector y supplies the y-axis values. Use type='b' if you want both points and line segments.
How to plot a graph in R programming with axis labels?
Pass xlab and ylab to plot(). For example, plot(x, y, type='l', xlab='Time', ylab='Cost') creates a line graph with axis labels for time and cost.
How do I plot only a line and not points in R?
Set the plot type to line only using type='l'. For example, plot(x, y, type='l', col='blue') draws a blue line without displaying point markers.
How to plot a line on a scatterplot in R?
Create the scatterplot first with plot(x, y, type='p'), and then add the line with lines(x, y). The lines() function adds line segments to an existing graph.
How to draw multiple line graphs in the same R plot?
Draw the first line with plot() and add the next lines using lines(). Set ylim to cover all y-values, and add legend() if the lines represent different series.
R line graph QA checklist
- The tutorial explains that
plot()withtype='l'draws a line graph in R. - The examples show the difference between
type='l',type='b',type='p', andtype='s'. - The tutorial includes how to add a line to an existing scatterplot using
lines(). - The multiple-line example uses
ylimso all series remain visible. - The save-to-file example correctly opens
png()and closes the graphics device withdev.off(). - The FAQ answers search-intent questions about plotting a line graph, plotting a graph, and plotting a line on a scatterplot in R.
Summary of plotting line graphs in R programming
In this R Tutorial, we have learned R plot function and some of the examples like plotting with both line and points, coloring the graph, drawing only points or lines on to the graph, etc.