R Bar Plot (Bar Chart)
R Bar Plot (or Bar Chart, or Bar Graph) is used to represent values as bars in a graph. Bar graph is usually used to visually represent comparison of magnitudes over different categories, or a dimension (like time).
To draw a bar plot in R programming, use barplot() function. barplot() function is in R graphics package. marplot() function can draw vertical and horizontal bars on the plot.
In this tutorial, we will learn the syntax of barplot() function, and how to use barplot() function to draw bar plots, and how to style the bars of bar plot.
Syntax
The syntax of barplot() function is
barplot(height, width = 1, space = NULL,
        names.arg = NULL, legend.text = NULL, beside = FALSE,
        horiz = FALSE, density = NULL, angle = 45,
        col = NULL, border = par("fg"),
        main = NULL, sub = NULL, xlab = NULL, ylab = NULL,
        xlim = NULL, ylim = NULL, xpd = TRUE, log = "",
        axes = TRUE, axisnames = TRUE,
        cex.axis = par("cex.axis"), cex.names = par("cex.axis"),
        inside = TRUE, plot = TRUE, axis.lty = 0, offset = 0,
        add = FALSE, ann = !add && par("ann"), args.legend = NULL, ...)
or, we can also use the following syntax
barplot(formula, data, subset, na.action,
        horiz = FALSE, xlab = NULL, ylab = NULL, ...)
Example 1 – Simple Bar Plot
In the following program, we will draw a simple bar plot using barplot() function.
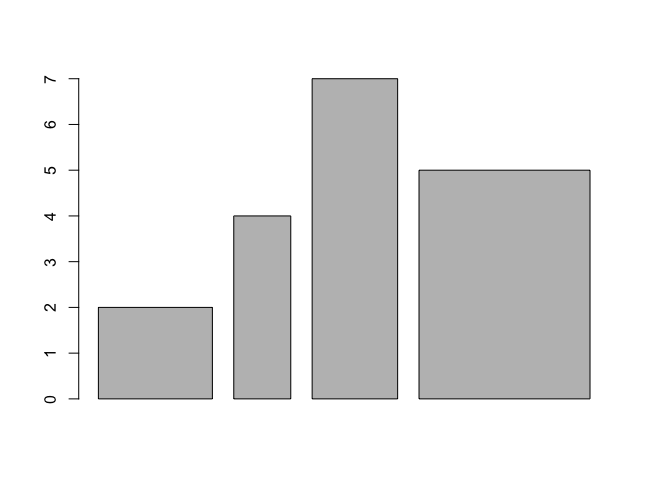
example.R
height <- c(2, 4, 7, 5)
barplot(height)
Output

Example 2 – Bars with Specific Width
In the following program, we will draw a bar plot with each bar set to a specific width. Pass required width values as vector to the width parameter in barplot() function call.
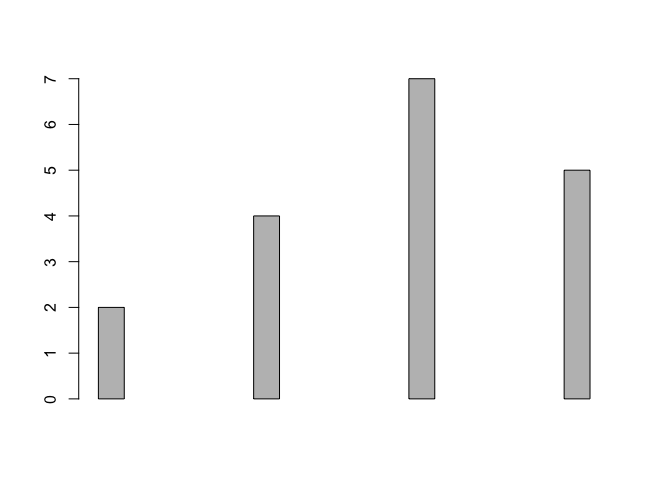
example.R
height <- c(2, 4, 7, 5)
barwidth <- c(2, 1, 1.5, 3)
barplot(height, width = barwidth)
Output
Example 3 – Space between Bars
In the following program, we will draw a bar plot with a specific space set between the bars. Pass required space value or pass a vector to the space parameter in barplot() function call.
example.R
height <- c(2, 4, 7, 5)
barplot(height, space = 5)
Output
Example 4 – Names for Bars
In the following program, we will specify names for bars, which shall be drawn below the bar in the bar plot. Pass required names value or a vector to the names parameter in barplot() function call.
example.R
height <- c(2, 4, 7, 5)
barplot(height, names = c("A", "B", "C", "D"))
Output

Example 5 – Bar Colors
In the following program, we specify colors for bars. Pass required color value or a vector of colors to the col parameter in barplot() function call.
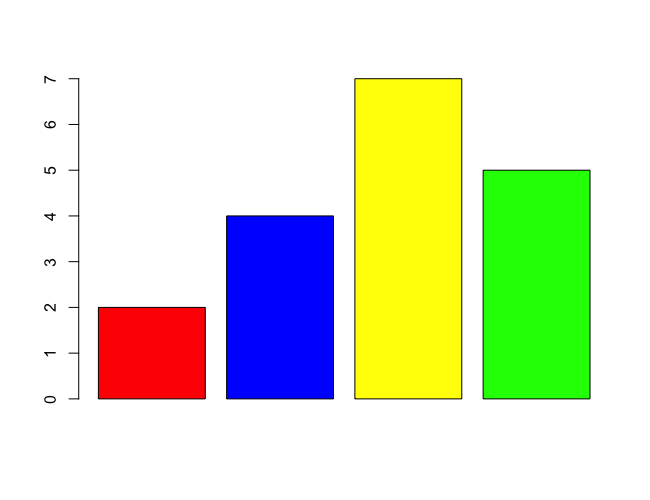
example.R
height <- c(2, 4, 7, 5)
barcolors <- c("red", "blue", "yellow", "green")
barplot(height, col = barcolors)
Output
Example 6 – Legend for Bar Plot
In the following program, we specify legend for this barplot. Pass required legend text value or a vector to the legend.text parameter in barplot() function call.
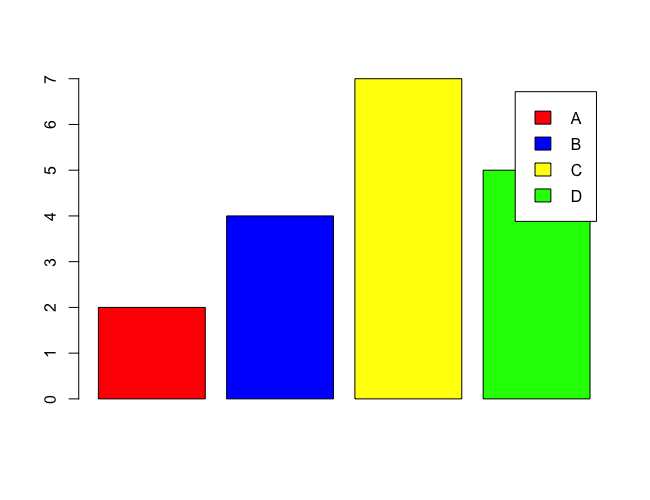
example.R
height <- c(2, 4, 7, 5)
barcolors <- c("red", "blue", "yellow", "green")
barplot(height, col = barcolors, legend = c("A", "B", "C", "D"))
Output
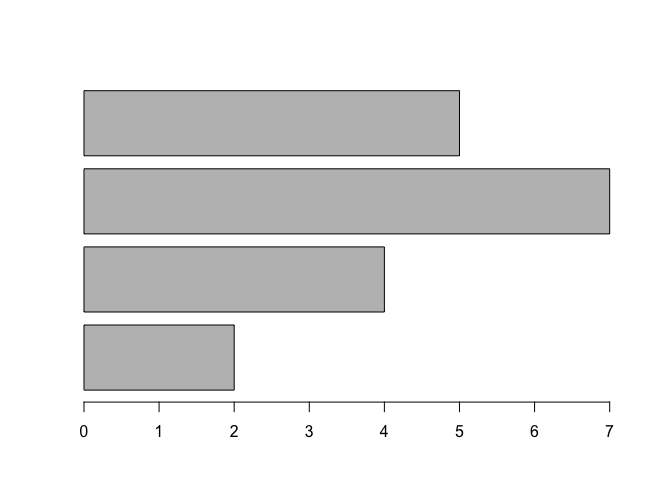
Example 7 – Horizontal Bar Plot
In the following program, we draw the bars horizontally in barplot. Pass the value of TRUE to the horiz parameter in barplot() function call.
example.R
height <- c(2, 4, 7, 5)
barplot(height, horiz = TRUE)
Output
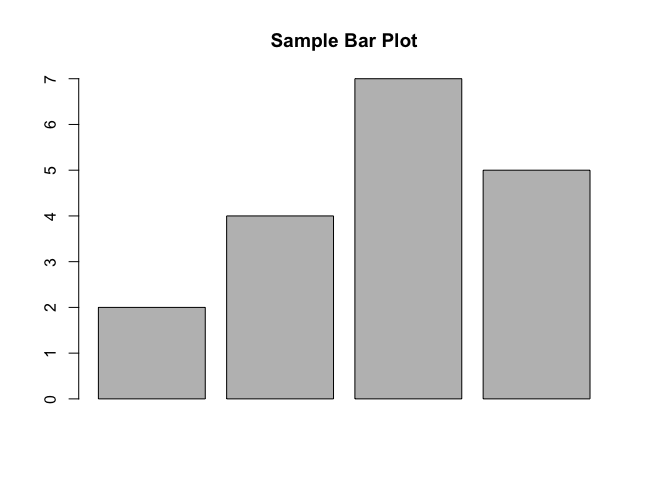
Example 8 – Main Title for Bar Plot
In the following program, we set the main title for barplot using main parameter of barplot() function.
example.R
height <- c(2, 4, 7, 5)
barplot(height, main = "Sample Bar Plot")
Output
Example 9 – X, Y axes labels
In the following program, we set the X and Y axes labels for barplot using xlab and ylab parameters of barplot() function, respectively.
example.R
height <- c(2, 4, 7, 5)
barplot(height, xlab = "Time", ylab = "Magnitude")
Output

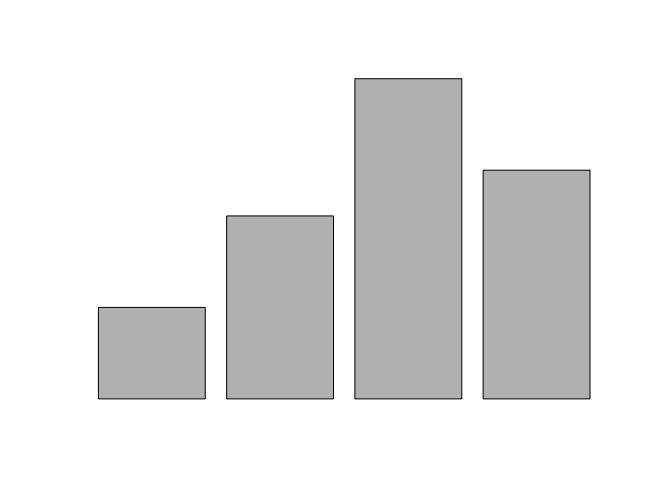
Example 10 – Bar Plot without Axes
In the following program, we will draw the bar plot without X and Y axes drawn to the plot using axes parameter of barplot() function.
example.R
height <- c(2, 4, 7, 5)
barplot(height, axes = FALSE)
Output
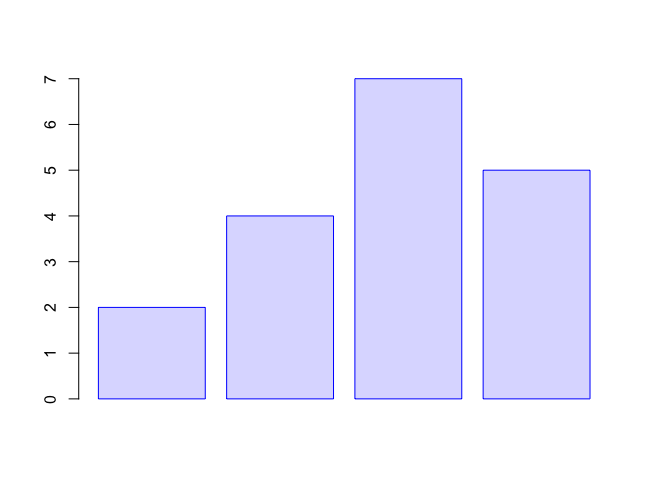
Example 11 – Border Color for Bars
In the following program, we will set border color for the bars using border parameter of barplot() function.
example.R
height <- c(2, 4, 7, 5)
barplot(height, col = "#DDDDFF", border = "#0000FF")
Output
Conclusion
In this R Tutorial, we learned how to draw Bar Plots in R using barplot() function, with the help of examples.