R barplot() – Horizontal Bars in Bar Plot
To draw horizontal bars in Bar Plot drawn using barplot() function, pass TRUE for horiz parameter in the function call.
horiz parameter is optional and accepts a logical value. The default value is FALSE, and the bars are drawn vertically. If TRUE, then bars are drawn horizontally.
Examples
In the following program, we draw horizontal bars in bar plot using horiz parameter.
example.R
</>
Copy
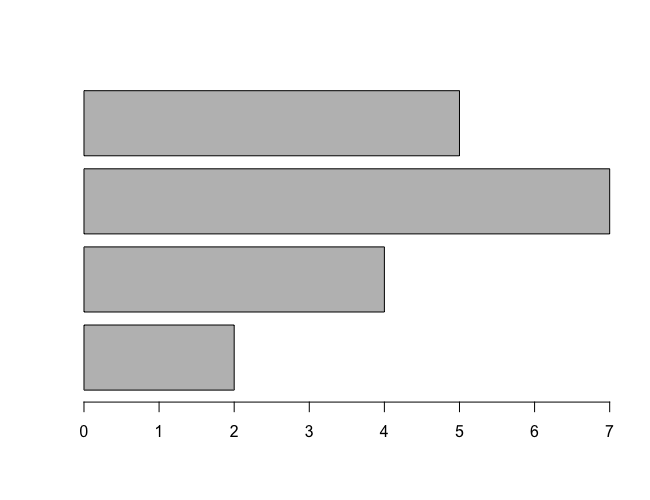
height <- c(2, 4, 7, 5)
barplot(height, horiz = TRUE)
Output
Conclusion
In this R Tutorial, we learned how to draw horizontal bars in Bar Plot using R barplot() function, with the help of examples.