R – Line Plot
To draw a line plot in R, call plot() function and along with the data to plot, pass the value “l” for “type” parameter.
In this tutorial, we will learn how to use plot() function to draw line plot, with example programs.
Syntax
The syntax to draw a line plot using plot() function is
</>
Copy
plot(x, y, type="l")Examples
In the following program, we will take two vectors in x and y, and plot a line graph, using plot() function.
example.R
</>
Copy
x <- c(1, 2, 3, 4)
y <- c(4, 7, 8, 10)
plot(x, y, type = "l")
Output

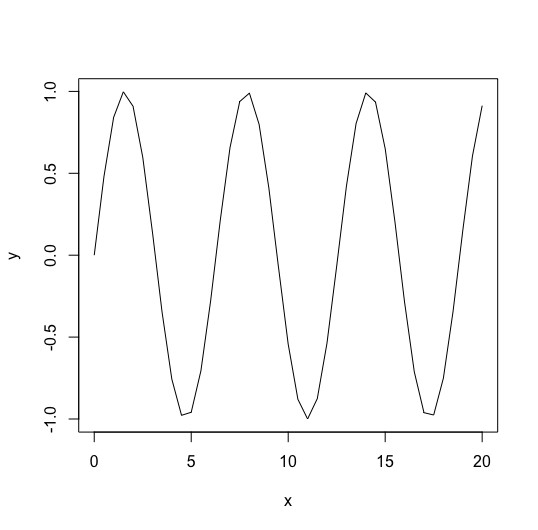
Now, let us take a vector x: sequence of values from 0 to 20 in steps of 0.5, and vector y: sin(x). We plot a line graph using these two vectors: x, y.
example.R
</>
Copy
x <- seq(0, 20, 0.5)
y <- sin(x)
plot(x, y, type = "l")
Output
Conclusion
sIn this R Tutorial, we learned how to plot a line graph in R, using plot() function, with the help of example programs.