R plot() – Set Title
To set title for the plot in R, call plot() function and along with the data to be plot, pass required title string value for the “main” parameter.
In this tutorial, we will learn how to set plot title, with example programs.
Syntax
The syntax to set plot title using plot() function is
</>
Copy
plot(x, y, main="This is Title")Examples
In the following program, we will take plot a graph, and set it its title to “Hello World Title”.
example.R
</>
Copy
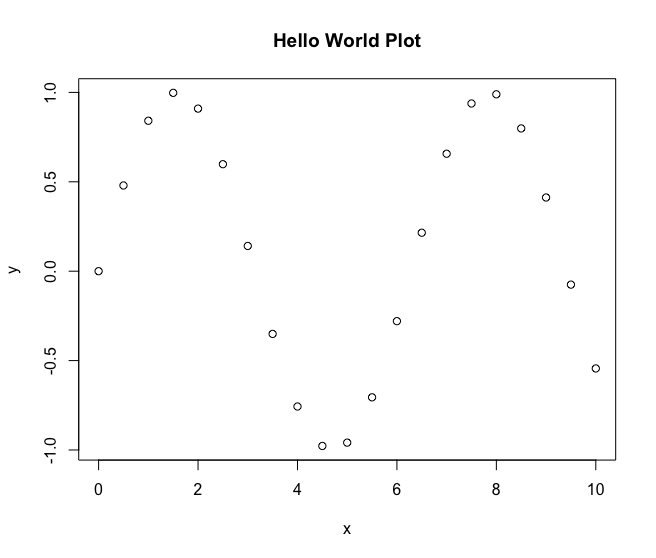
x <- seq(0, 10, 0.5)
y <- sin(x)
plot(x, y, main="Hello World Plot")
Output
Conclusion
In this R Tutorial, we learned how to set title for plot using “main” parameter of plot() function, with the help of example program.