R – Draw Plot from Two Vectors
To draw a plot from two vectors in R, where one vector represents data points along X axis, and the other vector represents data points along Y axis, call plot() function and pass the two vectors as arguments to the plot() function.
In this tutorial, we will learn how to use plot() function to draw a plot from two vectors, with example programs.
Syntax
The syntax to draw a plot from two vectors: x, y using plot() function is
</>
Copy
plot(x, y)Please note that the x and y vectors must be numeric, and of same length.
Example
In the following program, we will take two vectors in x and y, and plot Y vs X, using plot() function.
example.R
</>
Copy
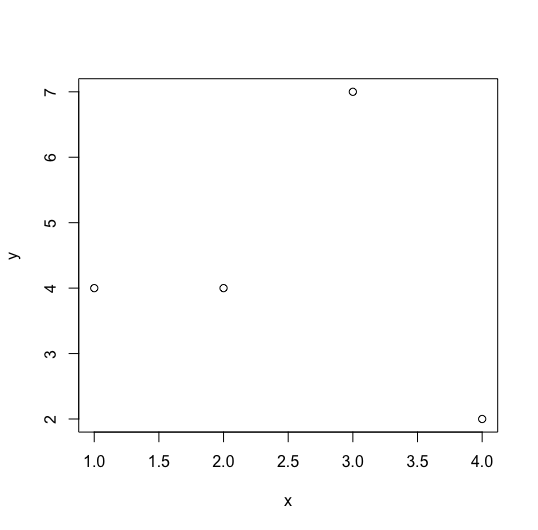
x <- c(1, 2, 3, 4)
y <- c(4, 4, 7, 2)
plot(x, y)
Output
Conclusion
In this R Tutorial, we learned how to plot a graph from two vectors in R, using plot() function, with the help of example program.