R barplot() – Set Border Color for Bars in Bar Plot
To set border color for bars in Bar Plot drawn using barplot() function, pass the required color value(s) for border parameter in the function call.
border parameter is optional and can accept a single value for color, or a vector of color values to set border color(s) for bars in the bar plot.
If single color value is passed for border parameter, then the border color of all bars will be set with this color.
If a vector is passed, whose length is equal to the the number of bars, then the bars will be set with the respective border color from the vector.
Examples
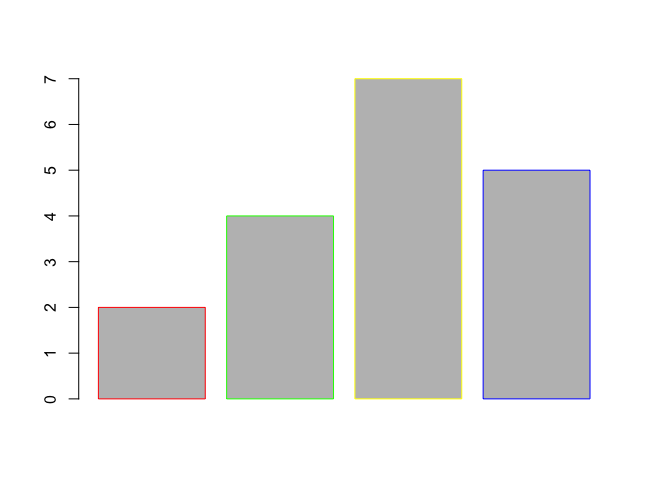
In the following program, we set different border color for each bar in the bar plot by passing a vector of colors to border parameter in barplot() function call.
example.R
height <- c(2, 4, 7, 5)
barplot(height, border = c("red", "green", "yellow", "blue"))
Output
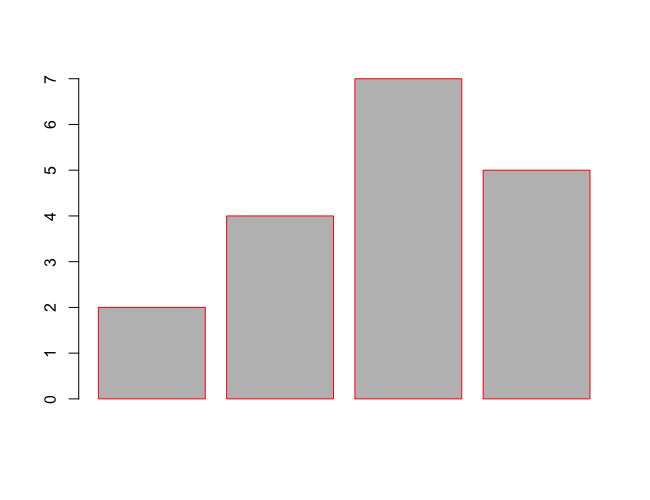
If we pass a single value for border parameter in barplot() function call, then this color value will be set as border color for all the bars.
example.R
height <- c(2, 4, 7, 5)
barplot(height, border = "red")
Output
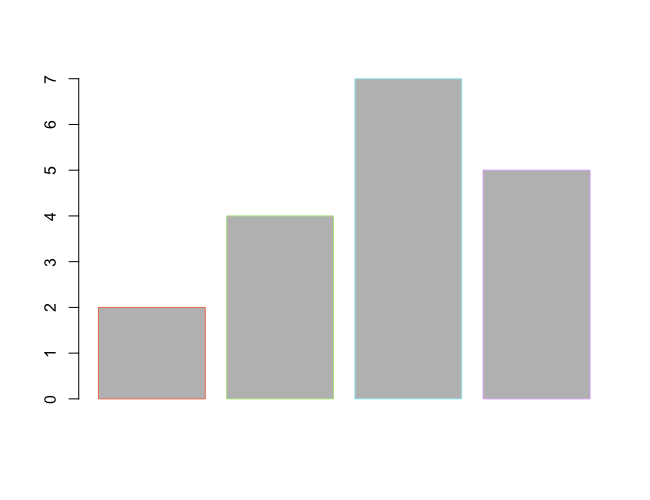
We can pass hex values in RGB or RGBA format for colors.
example.R
height <- c(2, 4, 7, 5)
barplot(height, border = c("#eb8060", "#b9e38d", "#a1e9f0", "#d9b1f0"))
Output
Conclusion
In this R Tutorial, we learned how to set specific border color(s) for bars in Bar Plot using R barplot() function, with the help of examples.