R barplot() – Set Names for Bars in Bar Plot
To set names for bars in Bar Plot drawn using barplot() function, pass the required names value for names parameter in the function call.
names parameter is optional and can accept a single value, or a vector to set names for bars in the bar plot.
Examples
In the following program, we pass a vector for names parameter in the barplot() function call.
example.R
</>
Copy
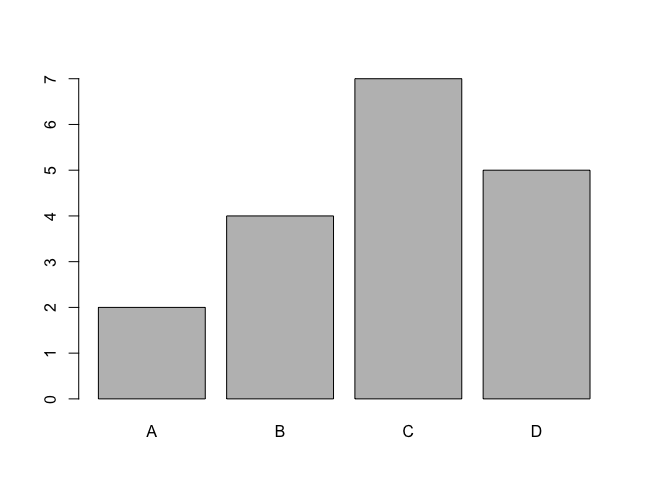
height <- c(2, 4, 7, 5)
barplot(height, names = c("A", "B", "C", "D"))
Output
If we set names parameter with a single value, then that single value would be assigned to the collective of bars.
example.R
</>
Copy
height <- c(2, 4, 7, 5)
barplot(height, names = "A")
Output

Conclusion
In this R Tutorial, we learned how to set names for bars in Bar Plot during call to the R barplot() function, with the help of examples.