R – Set Space between Bars in Bar Plot
To set space between bars in Bar Plot drawn using barplot() function, pass the required spacing value for space parameter in the function call.
space parameter is optional and can accept a single value or a vector to set different space between bars in the bar plot.
Examples
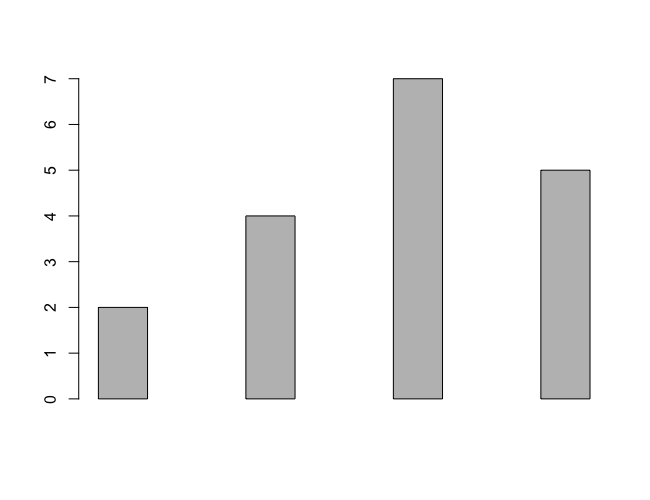
In the following program, we will set a space of 2 between the bars in the bar plot.
example.R
height <- c(2, 4, 7, 5)
barplot(height, space = 2)
Output
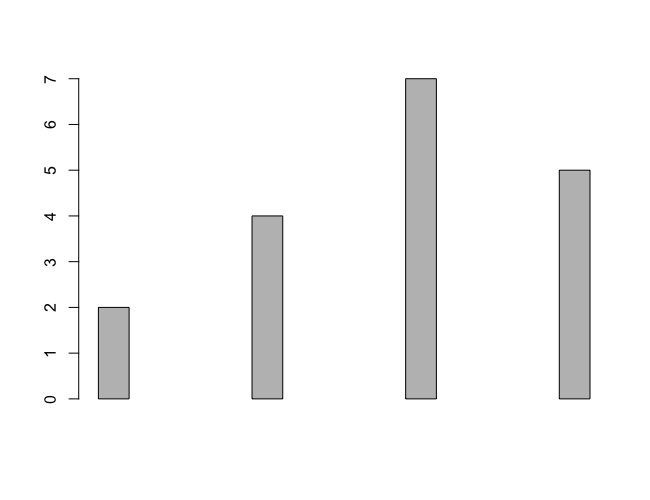
Now, let us set a space of 4, and see how it affects the bars spacing.
example.R
height <- c(2, 4, 7, 5)
barplot(height, space = 4)
Output
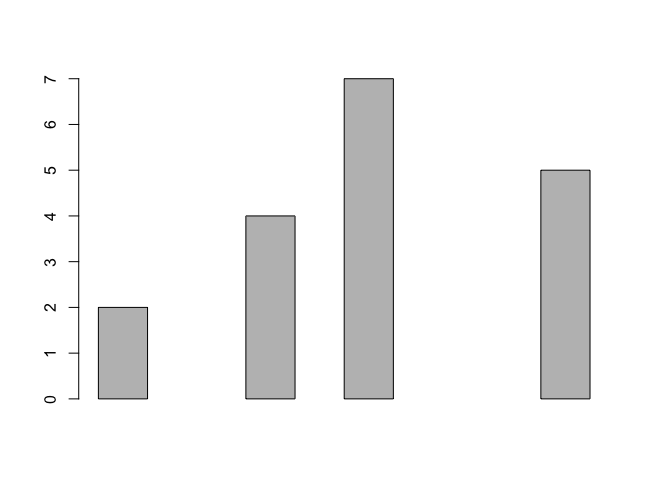
We can also pass a vector for space parameter of barplot() function.
The first value of space vector is the space between the Y axis and the first bar, the second value of the space vector is the space between in the first and second bar, and so on.
example.R
height <- c(2, 4, 7, 5)
barplot(height, space = c(0, 2, 1, 3))
Output
Conclusion
In this R Tutorial, we learned how to set specific space between bars in Bar Plot using R barplot() function, with the help of examples.