R barplot() – Set Width for Bars in Bar Plot
To set width for bars in Bar Plot drawn using barplot() function, pass the required width value for width parameter in the function call.
width parameter is optional and can accept a single value or a vector to set different width for different bars in the bar plot.
If length of width vector is less than the number of bars, then the width vector is re-cycled to the number of bars.
If we specify a single value for width, then there would be no visual effect for different values of width.
Examples
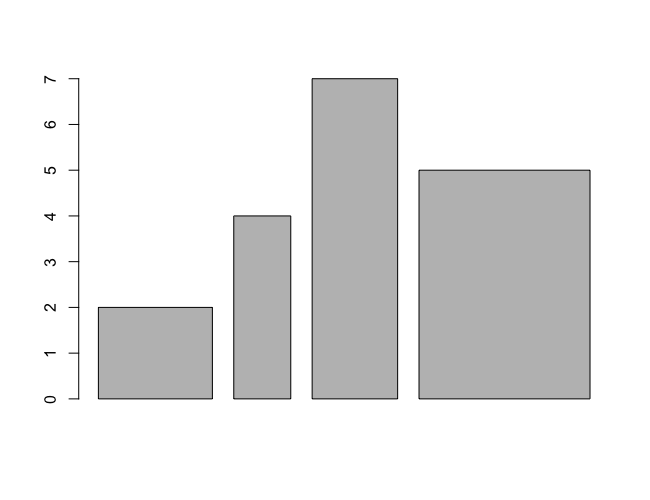
In the following program, we set different widths for different bars in the bar plot.
example.R
height <- c(2, 4, 7, 5)
barplot(height, width = c(2, 1, 1.5, 3))
Output
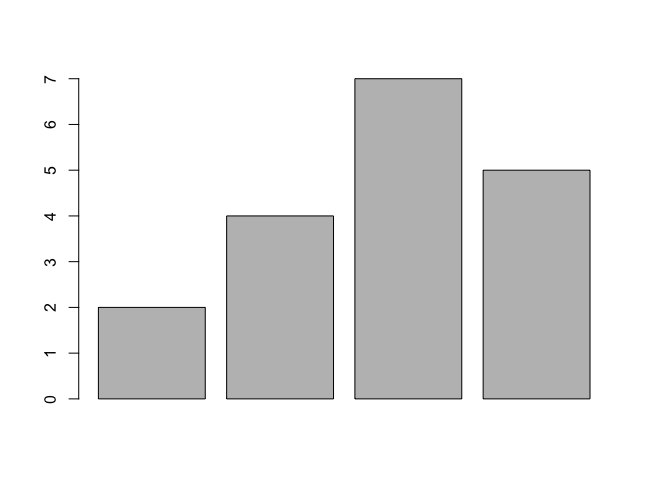
If we set width with a single value, then since all the bars would be of same width, there would be no visual change for any different width.
example.R
height <- c(2, 4, 7, 5)
barplot(height, width = 5)
Output
Conclusion
In this R Tutorial, we learned how to set specific width for bars in Bar Plot using R barplot() function, with the help of examples.