R barplot() – X, Y Axes Labels
To set X, Y axes labels for Bar Plot drawn using barplot() function, pass the required label values for xlab parameter and ylab parameter in the function call respectively.
xlab parameter is optional and can accept a value to set X-axis label for the bar plot.
ylab parameter is optional and can accept a value to set Y-axis label for the bar plot.
Example
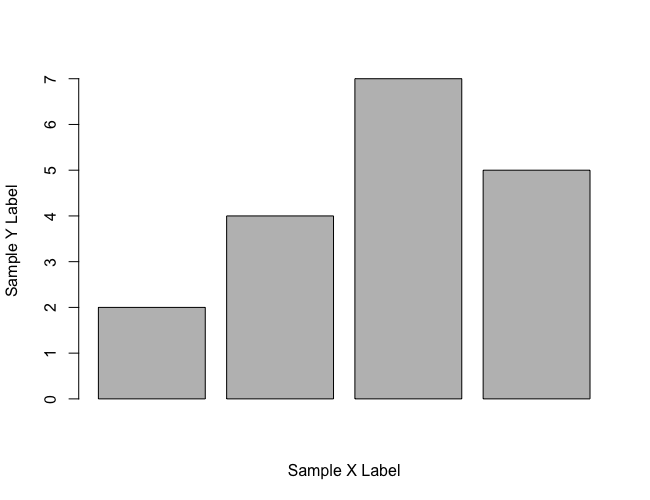
In the following program, we set X, Y axes labels for bar plot.
example.R
</>
Copy
height <- c(2, 4, 7, 5)
barplot(height, xlab = "Sample X Label", ylab = "Sample Y Label")
Output
Conclusion
In this R Tutorial, we learned how to set X-axis and Y-axis labels for Bar Plot drawn using R barplot() function, with the help of example program.