Matplotlib PyPlot – Set Color(s) for Bars in Bar Plot
To set color for bars in a Bar Plot using Matplotlib PyPlot API, call matplotlib.pyplot.bar() function, and pass required color value(s) to color parameter of bar() function.
The definition of matplotlib.pyplot.bar() function with color parameter is
bar(x, height, color=None)Of course, there are other named parameters, but for simplicity, only color parameter is given.
where
| Parameter | Description |
|---|---|
| color | The color(s) of the bar which takes color or list of color. |
Note: If we are providing a list of colors for color parameter, the length of this list of colors should match the length of x and height.
Example
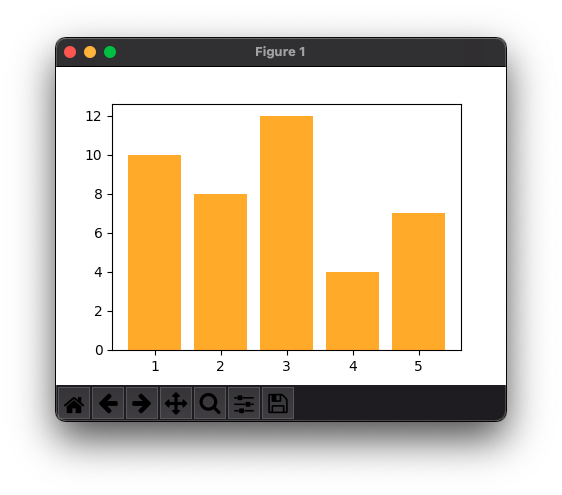
In the following program, we will draw a bar plot with bars having orange color.
example.py
import matplotlib.pyplot as plt

#data
x = [1, 2, 3, 4, 5]
h = [10, 8, 12, 4, 7]
c = 'orange'

#bar plot
plt.bar(x, height = h, color = c)

plt.show()
Output
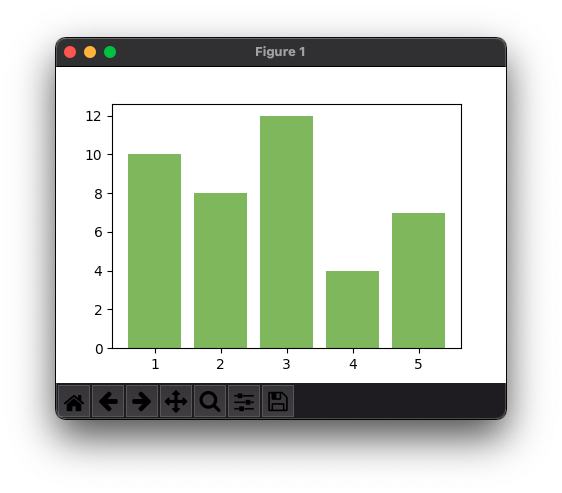
We can also give a hex color in RGB or RGBA format. In the following program, we will set the color of bar faces in the bar plot to the color represented by the hex color '#7eb54e'.
example.py
import matplotlib.pyplot as plt

#data
x = [1, 2, 3, 4, 5]
h = [10, 8, 12, 4, 7]
c = '#7eb54e'

#bar plot
plt.bar(x, height = h, color = c)

plt.show()
Output
Now, let us apply different colors for bar faces of the bar plot, by passing a list of colors for color parameter.
example.py
import matplotlib.pyplot as plt

#data
x = [1, 2, 3, 4, 5]
h = [10, 8, 12, 4, 7]
c = ['red', 'yellow', 'black', 'blue', 'orange']

#bar plot
plt.bar(x, height = h, color = c)

plt.show()
Output

Conclusion
In this Matplotlib Tutorial, we learned how to set color(s) for bar faces in bar plot using Matplotlib PyPlot API.