Matplotlib PyPlot – Set Width for Bars in Bar Plot
To set width for bars in a Bar Plot using Matplotlib PyPlot API, call matplotlib.pyplot.bar() function, and pass required width value to width parameter of bar() function.
The default value for width parameter is 0.8. We may assign a new value in the range [0.0, 1.0].
The definition of matplotlib.pyplot.bar() function with width parameter is
bar(x, height, width=0.8, bottom=None, *, align='center', data=None, **kwargs)where
| Parameter | Description |
|---|---|
| width | The width(s) of the bars which takes float or array-like. The default value is: 0.8. |
To set different width for each bar in the bar plot, refer the following tutorial.
How to set Different Widths for Bars of Bar Plot in Matplotlib?
Example
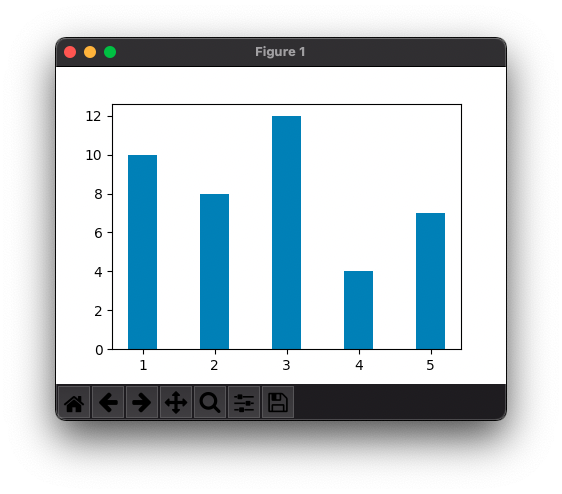
In the following program, we will draw a bar plot with bars having width of 0.4.
example.py
import matplotlib.pyplot as plt

#data
x = [1, 2, 3, 4, 5]
h = [10, 8, 12, 4, 7]

#bar plot
plt.bar(x, height = h, width = 0.4)

plt.show()
Output
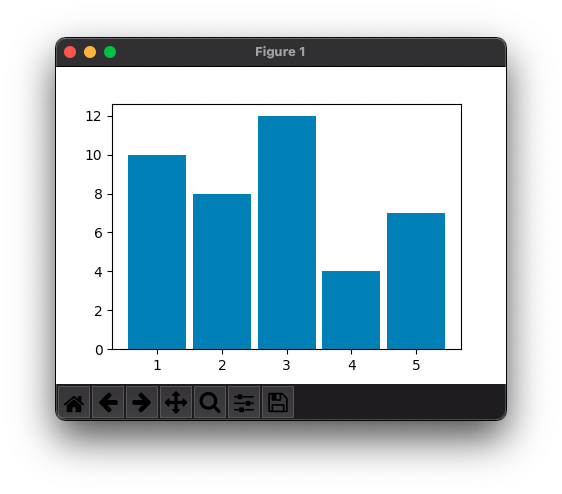
Now, let us draw a bar plot with bars having width of 0.9.
example.py
import matplotlib.pyplot as plt

#data
x = [1, 2, 3, 4, 5]
h = [10, 8, 12, 4, 7]

#bar plot
plt.bar(x, height = h, width = 0.9)

plt.show()
Output
As to test a boundary condition, let us draw a bar plot with bars of width 1.0. This may not leave any space between the bars. The bars appear touching each other.
example.py
import matplotlib.pyplot as plt

#data
x = [1, 2, 3, 4, 5]
h = [10, 8, 12, 4, 7]

#bar plot
plt.bar(x, height = h, width = 1.0)

plt.show()
Output

Conclusion
In this Matplotlib Tutorial, we learned how to set width for bars in bar plot using Matplotlib PyPlot API.