Matplotlib – Scatter Plot
In Matplotlib, we can draw a Scatter Plot using scatter() function of matplotlib.pyplot. A scatter plot is a plot of y vs. x with varying marker size and/or color.

The definition of scatter plot with all the parameters is
scatter(x, y, s=None, c=None, marker=None, cmap=None, norm=None, vmin=None, vmax=None, alpha=None, linewidths=None, *, edgecolors=None, plotnonfinite=False, data=None, **kwargs)Example
In the following example program, we have drawn a scatter plot for the data points represented by x, y. The values for x and y are generated randomly using numpy.random. 50 points were generated in the range (0, 50).
example.py
import matplotlib.pyplot as plt
import numpy as np

#data
x = np.random.randint(0, 50, 50)
y = np.random.randint(0, 50, 50)

#scatter plot
plt.scatter(x, y)

plt.show()
Output

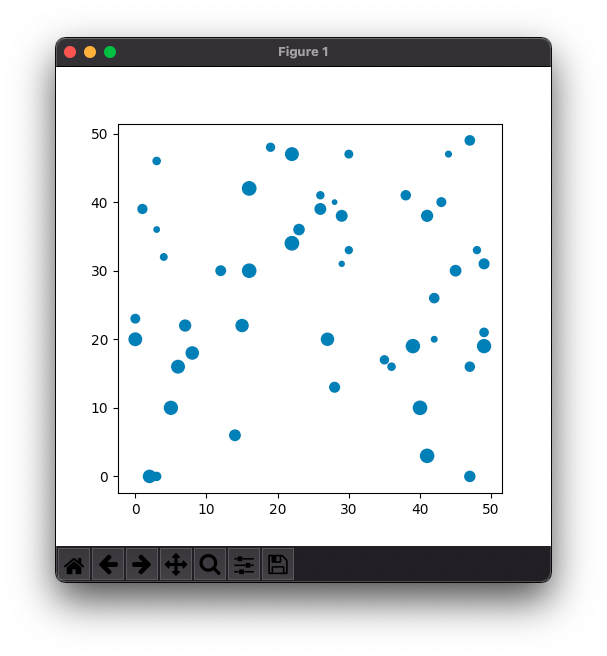
Now, let us specify size to each of the points. To specify size to each of the markers, pass a list for named parameter s to scatter() function. Respective values from the s size list shall be applied to the markers drawn at points specified by x and y.
In the following example, the size for markers is generated randomly using numpy.random. 50 values are generated for size, in the range (10, 100).
example.py
import matplotlib.pyplot as plt
import numpy as np

#data
x = np.random.randint(0, 50, 50)
y = np.random.randint(0, 50, 50)
#size
size = np.random.randint(10, 100, 50)

#scatter plot
plt.scatter(x, y, s = size)

plt.show()
Output
We can set color to each of the marker in the scatter plot. Provide the list of colors as fourth parameter or named parameter c for scatter() function.
In the following example, the color for markers is generated randomly using numpy.random. 50 values are generated for color, in the range (10, 100).
example.py
import matplotlib.pyplot as plt
import numpy as np

#data
x = np.random.randint(0, 50, 50)
y = np.random.randint(0, 50, 50)
#size
size = np.random.randint(10, 100, 50)
#color
color = np.random.randint(10, 100, 50)

#scatter plot
plt.scatter(x, y, s = size, c = color)

plt.show()
Output
Conclusion
In this Matplotlib Tutorial, we learned how to draw a Scatter Plot using scatter() function of PyPlot API in Matplotlib.