Matplotlib Scatter Plot – Marker Shape
To set specific marker for drawing points on Scatter Plot in Matplotlib, pass required marker string to marker parameter of scatter() function.
The following table lists some of the most used markers in Scatter Plot.
| marker value | Description |
|---|---|
"." | point |
"," | pixel |
"o" | circle |
"v" | triangle_down |
"^" | triangle_up |
"<" | triangle_left |
">" | triangle_right |
"1" | tri_down |
"2" | tri_up |
"3" | tri_left |
"4" | tri_right |
"8" | octagon |
"s" | square |
"p" | pentagon |
The following is definition of scatter() function with marker parameter, at fight position, whose default value is None.
</>
Copy
matplotlib.pyplot.scatter(x, y, s=None, c=None, marker=None, cmap=None, norm=None, vmin=None, vmax=None, alpha=None, linewidths=None, *, edgecolors=None, plotnonfinite=False, data=None, **kwargs)Example
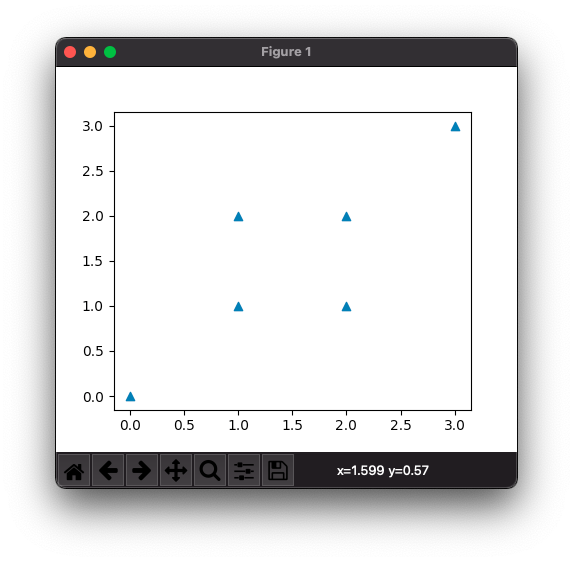
In the following example, we will draw a scatter plot with 6 (six) data points, and set triangle_up as marker.
example.py
</>
Copy
import matplotlib.pyplot as plt

#data
x = [0, 1, 1, 2, 2, 3]
y = [0, 1, 2, 1, 2, 3]

#marker - triangle up
m = "^"

#scatter plot
plt.scatter(x, y, marker = m)

plt.show()
Output
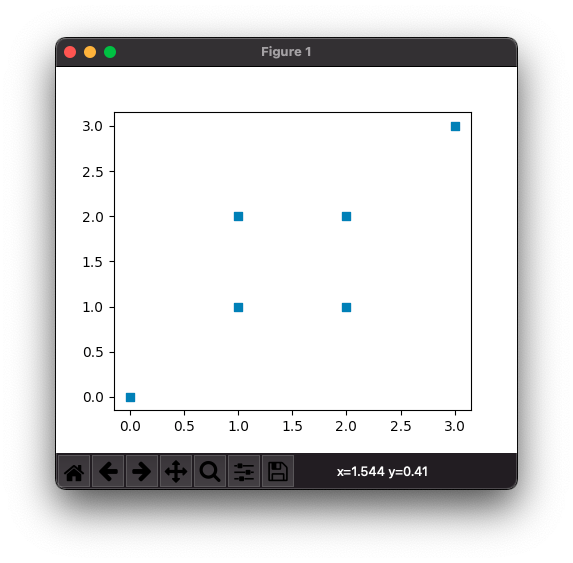
Let us try out another marker, say ‘square’.
example.py
</>
Copy
import matplotlib.pyplot as plt

#data
x = [0, 1, 1, 2, 2, 3]
y = [0, 1, 2, 1, 2, 3]

#marker - square
m = "s"

#scatter plot
plt.scatter(x, y, marker = m)

plt.show()
Output
Conclusion
In this Matplotlib Tutorial, we learned how to set a specific marker for drawing data points in Scatter Plot.