Matplotlib Scatter Plot – Markers’ Size
To set specific size for markers in Scatter Plot in Matplotlib, pass required sizes for markers as list, to s parameter of scatter() function, where each size is applied to respective data point.
We can specify the size as a number.
The following is definition of scatter() function with s parameter, at third position, whose default value is None.
matplotlib.pyplot.scatter(x, y, s=None, c=None, marker=None, cmap=None, norm=None, vmin=None, vmax=None, alpha=None, linewidths=None, *, edgecolors=None, plotnonfinite=False, data=None, **kwargs)Note: The length of the size list that we give for named parameter s, should be consistent with the lengths of x and y.
Example
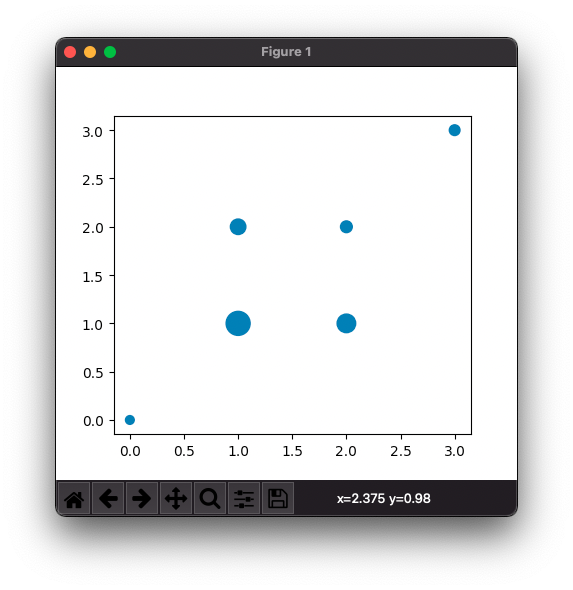
In the following example, we will draw a scatter plot with 6 (six) data points, and set specific size for the markers of these data points on the Scatter plot, with a list of numbers. Each number in the list is the size of the marker in Scatter plot.
example.py
import matplotlib.pyplot as plt

#data
x = [0, 1, 1, 2, 2, 3]
y = [0, 1, 2, 1, 2, 3]

#markers' size
size = [40, 300, 125, 180, 72, 60]

#scatter plot
plt.scatter(x, y, s = size)

plt.show()
Output
Conclusion
In this Matplotlib Tutorial, we learned how to set size for markers in Scatter Plot.