Matplotlib Scatter Plot – Markers’ Color
To set color for markers in Scatter Plot in Matplotlib, pass required colors for markers as list, to c parameter of scatter() function, where each color is applied to respective data point.
We can specify the color in Hex format, or matplotlib inbuilt color strings, or an integer.
The following is definition of scatter() function with c parameter, at fourth position, whose default value is None.
matplotlib.pyplot.scatter(x, y, s=None, c=None, marker=None, cmap=None, norm=None, vmin=None, vmax=None, alpha=None, linewidths=None, *, edgecolors=None, plotnonfinite=False, data=None, **kwargs)Note: The length of the colors list that we give for named parameter c, should be consistent with the lengths of x and y.
Example
In the following example, we will draw a scatter plot with 6 (six) data points, and set the colors for the markers with a list of colors, where each color is defined using matplotlib inbuilt color strings.
example.py
import matplotlib.pyplot as plt

#data
x = [0, 1, 1, 2, 2, 3]
y = [0, 1, 2, 1, 2, 3]

#color
color = ['red', 'blue', 'yellow', 'green', 'orange', 'cyan']

#scatter plot
plt.scatter(x, y, c = color)

plt.show()
Output

Hex Colors
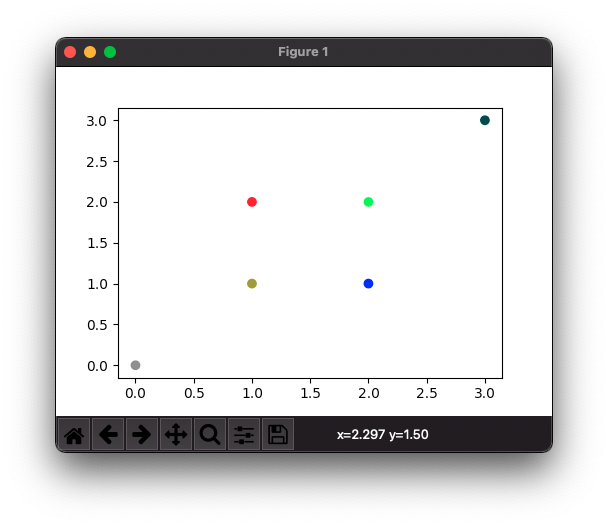
Now let us specify hex colors for the markers.
example.py
import matplotlib.pyplot as plt

#data
x = [0, 1, 1, 2, 2, 3]
y = [0, 1, 2, 1, 2, 3]

#hex colors
color = ['#888888', '#999729', '#FF0022', '#0000FF', '#44FF44', '#004444']

#scatter plot
plt.scatter(x, y, c = color)

plt.show()
Output
Numbers as Colors
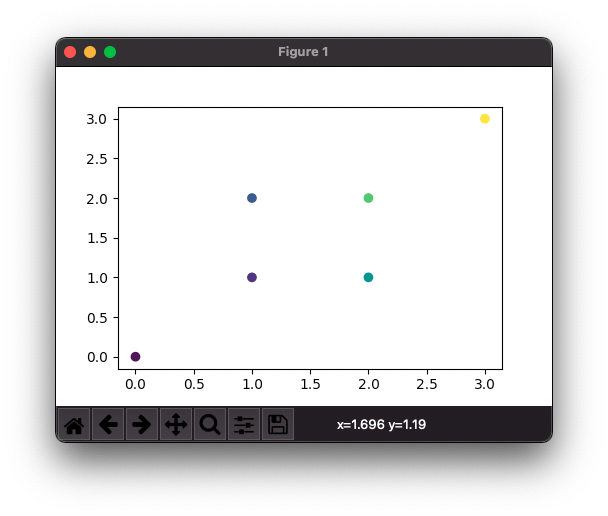
We can also specify, just some integers for the color values.
example.py
import matplotlib.pyplot as plt

#data
x = [0, 1, 1, 2, 2, 3]
y = [0, 1, 2, 1, 2, 3]

#number colors
color = [1, 25, 50, 100, 150, 200]

#scatter plot
plt.scatter(x, y, c = color)

plt.show()
Output
Conclusion
In this Matplotlib Tutorial, we learned how to set color for markers in Scatter Plot.