Save Plot Figure as JPG or PNG
To save plot figure as JPG or PNG file, call savefig() function on matplotlib.pyplot object. Pass the file name along with extension, as string argument, to savefig() function.
The following code snippet shows how to save a plot figure as jpg.
</>
Copy
import matplotlib.pyplot as plt

plt.savefig("output.jpg") #save as jpg
plt.savefig("output.png") #save as png
Example
In this example, we will draw a plot, and save the plot as “output.jpg”.
example.py
</>
Copy
import matplotlib.pyplot as plt

# data for plotting
x = [0, 1, 2, 3, 4, 5, 6, 7, 8, 9, 10, 11]
y = [5, 7, 8, 1, 4, 9, 6, 3, 5, 2, 1, 8]

plt.plot(x, y)

plt.xlabel('x-axis label')
plt.ylabel('y-axis label')
plt.title('Matplotlib Example')

plt.savefig("output.jpg")
Output
An image file, with the plot figure, and with the name output.jpg is created.
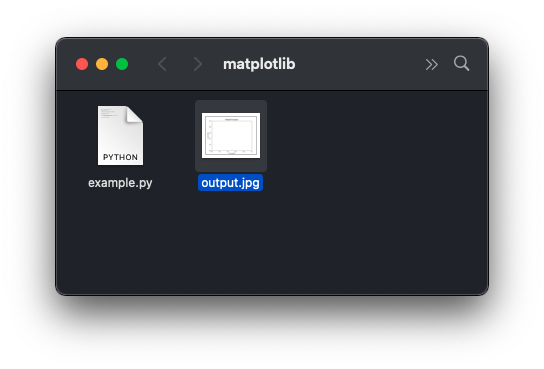
Since we have given only the name of file, the file is saved next to the python file. We could also give an absolute path to save the plot figure to a specific location.
Conclusion
Concluding this Matplotlib Tutorial, we learned how to save the plot as JPG/PNG file in Matplotlib.