Matplotlib Plot Hex Color
To color the plot with a Hex Color string in matplotlib, call plot() function on matplotlib.pyplot object and pass the color string for fmt parameter.
The definition of plot() function with x, y and fmt parameters is
</>
Copy
plot([x], y, [fmt])Sample plot() function calls with fmt parameter containing Hex String for color.
</>
Copy
import matplotlib.pyplot as plt

plt.plot(x, y, '#FF0055')
plt.plot(x, y, '#FFFF55')
plt.plot(x, y, '#110055')
Example
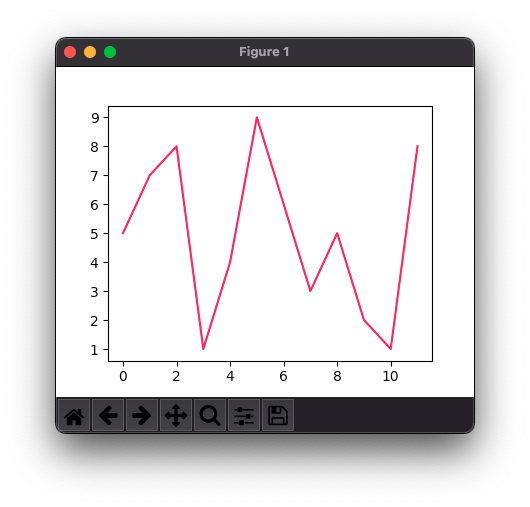
In this example, we will plot Y vs X with the plot color of ‘#FF0055’.
example.py
</>
Copy
import matplotlib.pyplot as plt

# x axis and y axis data
x = [0, 1, 2, 3, 4, 5, 6, 7, 8, 9, 10, 11]
y = [5, 7, 8, 1, 4, 9, 6, 3, 5, 2, 1, 8]

#plot y vs x, and set the color for plot
plt.plot(x, y, '#FF0055')

#show plot to user
plt.show()
Output
Conclusion
Concluding this Matplotlib Tutorial, we learned how to color plot with Hex color string.