Matplotlib – Set Line Color for Step Plot
To set specific line color for Step Plot in Matplotlib, call matplotlib.pyplot.step() function, and pass required color as string value for color parameter of step() function.
The definition of matplotlib.pyplot.step() function with color parameter is
</>
Copy
step(x, y, color='red')Of course, there are other named parameters, but for simplicity, only color parameter is given along with required x and y.
where
| Parameter | Description |
|---|---|
| color | A string value. The color of line in Step Plot. The value can be one of the standard color strings like: ‘red’, ‘green’, ‘yellow’, etc., or HEX value like ‘#FF0025’, etc. |
Example
Standard Color Value
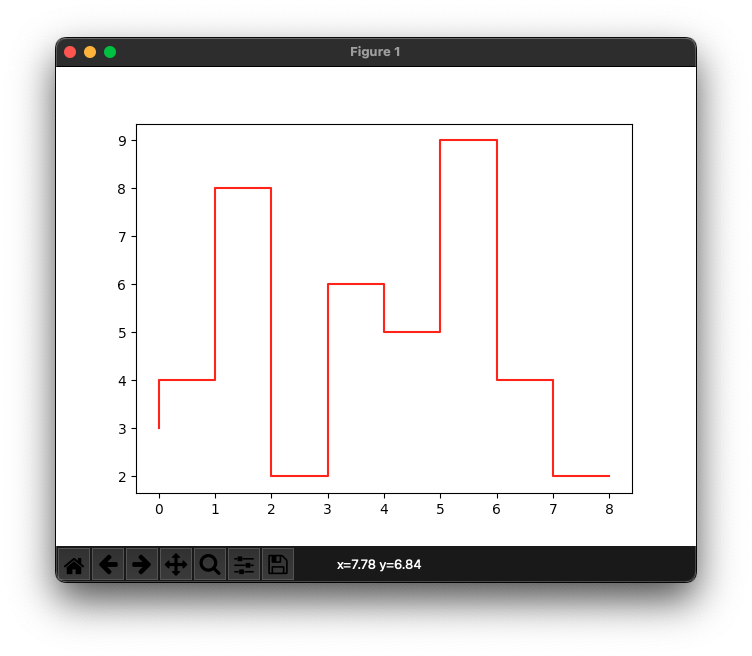
In the following program, we will draw a Step Plot with some some sample data, and 'red' as color for the Step Plot.
example.py
</>
Copy
import matplotlib.pyplot as plt

# make data
x = [0, 1, 2, 3, 4, 5, 6, 7, 8]
y = [3, 4, 8, 2, 6, 5, 9, 4, 2]

#draw step plot
plt.step(x, y, color='red')

#show plot as image
plt.show()
Output
HEX Color Value
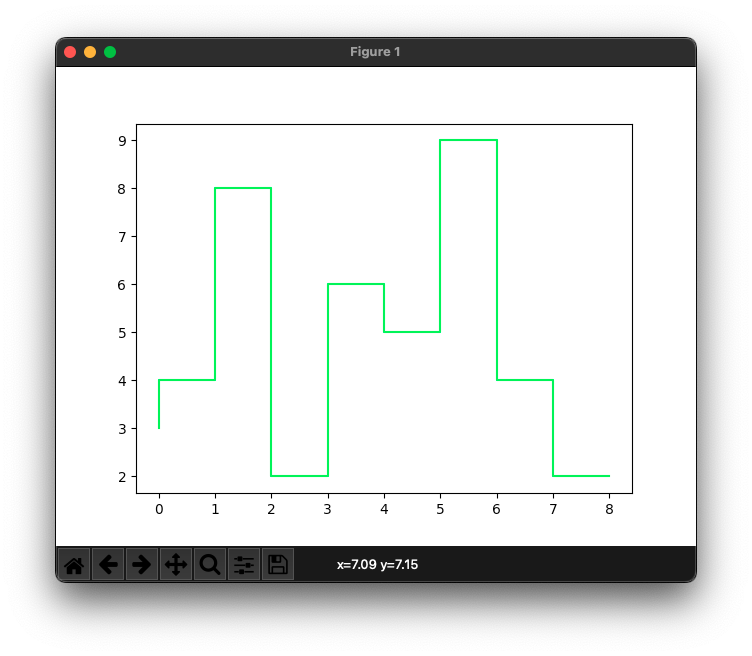
Now, let us provide a HEX color value of '#04FA45' for line color and draw the Step Plot.
example.py
</>
Copy
import matplotlib.pyplot as plt

# make data
x = [0, 1, 2, 3, 4, 5, 6, 7, 8]
y = [3, 4, 8, 2, 6, 5, 9, 4, 2]

#draw step plot
plt.step(x, y, color='#04FA45')

#show plot as image
plt.show()
Output
Conclusion
In this Matplotlib Tutorial, we learned how to set line color for Step Plot using Matplotlib PyPlot API.