What is a Salesforce Matrix report?
A Salesforce Matrix report summarizes report data in a grid by grouping records on both rows and columns. It is similar to a Summary report, but it is more useful when you need to compare two grouped dimensions, such as Opportunity Stage by Close Date.
In a Matrix report, Salesforce can show values at the cell level, row subtotal level, column subtotal level, and grand total level. For example, an Opportunity Matrix report can show Stage as row groups, Close Date as column groups, and Sum of Amount inside the grid.
- Salesforce Matrix reports group records by row fields and column fields.
- Matrix reports are used to compare summarized values across two report dimensions.
- Matrix reports can be used as the source report for Dashboard components.
- These are used to summarize large amounts of Salesforce report data.
Salesforce Matrix report vs Summary report vs Tabular report
The main difference between a Matrix report and a Summary report is how grouping works. A Summary report groups data down the rows only. A Matrix report groups data down rows and across columns, so it helps when the same measure must be compared across two categories.
| Report format | Grouping style | Useful example |
|---|---|---|
| Tabular report | No grouped row or column totals | A simple list of open opportunities |
| Summary report | Rows grouped by one or more fields | Opportunity Amount by Stage |
| Matrix report | Rows and columns grouped by fields | Opportunity Amount by Stage and Close Quarter |
| Joined report | Multiple report blocks in one report | Different report views shown together |
When to use a Salesforce Matrix report for summarized data
Use a Matrix report when the report question has two grouping parts. If the question is “How much pipeline is in each Stage?”, a Summary report is usually enough. If the question is “How much pipeline is in each Stage for each Close Date period?”, a Matrix report is the better choice.
How to create a Matrix report in Salesforce.com?
In Summary report we can not group data by rows and columns so we go for matrix reports. Login Salesforce and navigate to Reports | New Report. Select the report type that contains the object and fields required for the Matrix report.
Here we are going to create Salesforce Matrix report for the object opportunity. We can convert Summary report to matrix report. As shown below in matrix report, row is grouped by Stage and column in grouped by Close date. This is the advantage of matrix reports.
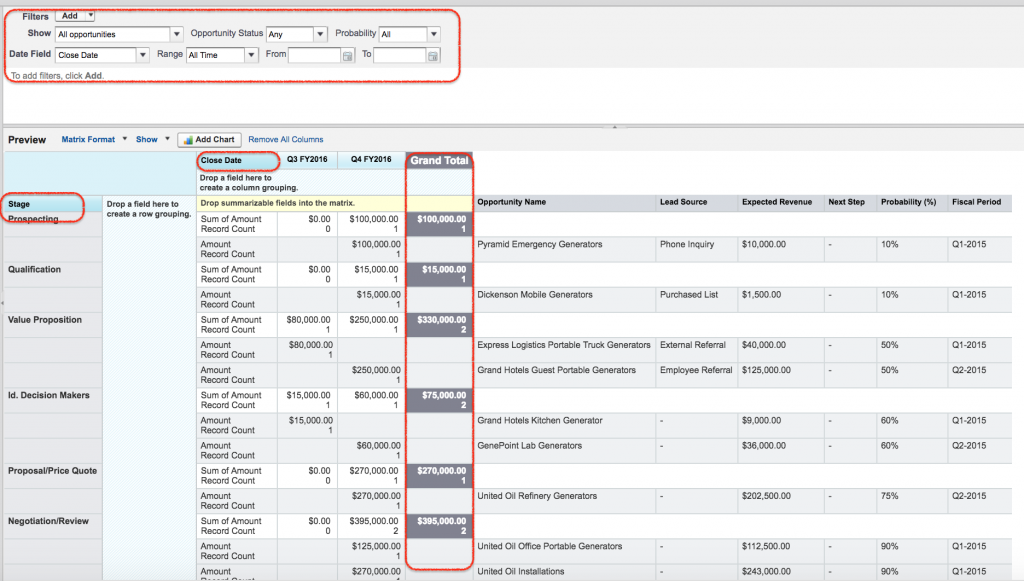
Create an Opportunity Matrix report grouped by Stage and Close Date
- Open the Reports tab and click New Report.
- Select an Opportunity report type that includes Opportunity Name, Stage, Close Date, Amount, Type, and Lead Source.
- Add the required fields to the report preview pane.
- Group rows by Stage so that opportunities are arranged by sales stage.
- Group columns by Close Date. If needed, group the date by month, quarter, fiscal quarter, or fiscal year.
- Summarize the Amount field with Sum so each cell shows the total opportunity amount for that Stage and Close Date group.
- Review filters such as Show Me, date range, owner, stage, and opportunity status before reading the totals.
- Click Run to view the Matrix report result.
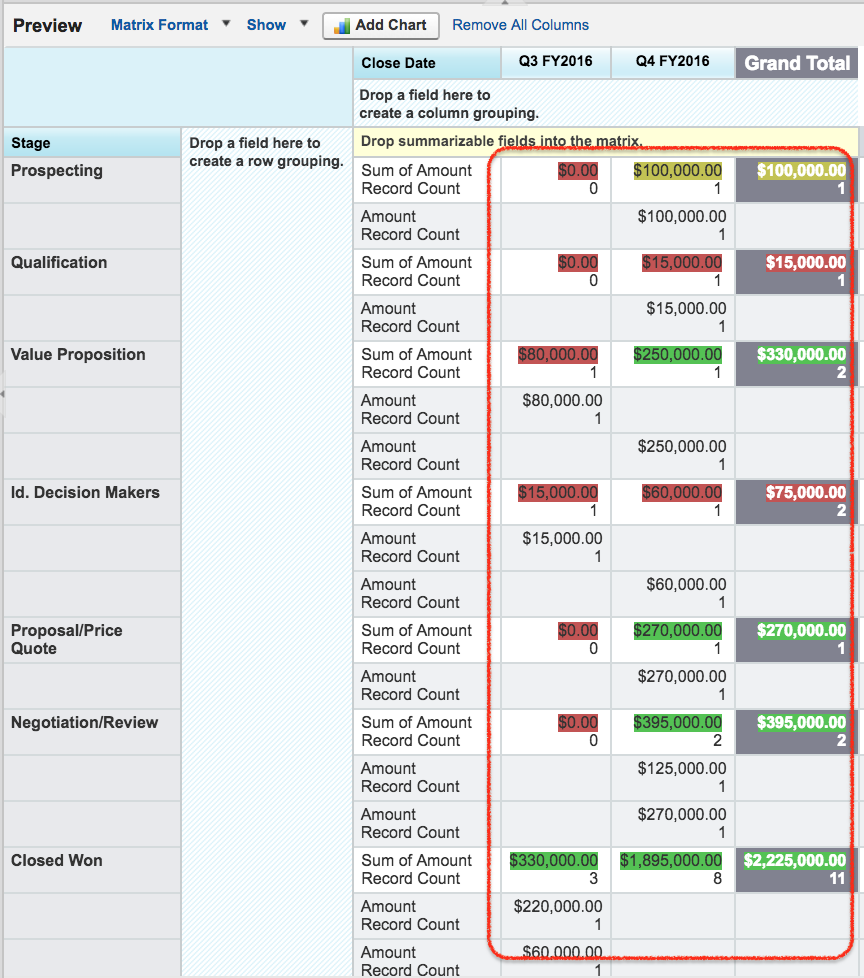
Here we got information what is the total amount and what is the sum of total amount for a special stage. If we want an information what is the total amount for a particular closed date. here close date is grouped by fiscal year. We summarized amount information below.We can add more fields for row and column grouping.
How row groups, column groups, and field summaries work in Matrix reports
A Matrix report has three important parts: row groups, column groups, and summarized fields. In the Opportunity example, Stage is the row group, Close Date is the column group, and Sum of Amount is the summarized field. This lets Salesforce show totals for each Stage, totals for each Close Date period, and a grand total for all matching records.
- Row group: the main category shown down the report, such as Stage or Owner.
- Column group: the comparison category shown across the report, such as Close Date or Fiscal Period.
- Summarized field: the numeric, currency, or percent field calculated inside the grid, such as Sum of Amount.
- Grand total: the total value after the report filters and record access rules are applied.
Summarize Amount and other fields in a Salesforce Matrix report
Summarized fields are the values calculated in the Matrix report grid. Currency, number, and percent fields are common choices. For Opportunity reports, Amount is often summarized with Sum. Probability may be summarized with Average when the report needs an average probability view.
- Sum is useful for total pipeline, revenue, quantity, or case effort.
- Average is useful for average deal size, average probability, or average response value.
- Minimum and Maximum are useful when the lowest or highest value in each group matters.
- A custom summary formula is useful when the report needs a percentage, ratio, or calculated comparison based on grouped totals.
Conditional highlighting in Matrix reports.
Conditional Highlighting is a powerful way to show values in report within given limits. We can specify colours for different ranges of values in reports using conditional highlighting.
In Matrix reports, conditional highlighting is most useful when the summarized values need quick review. For example, low pipeline totals can use one color range and high pipeline totals can use another range. Set breakpoints according to meaningful reporting thresholds.
- Click on show drop down and select Conditional Highlighting.
The color to show data for low breakpoint and high break point must be defined as shown below.
Now the result report will be displayed as shown below.
- Finally click on Run report button.
- Save the report.
Use Salesforce Matrix reports as dashboard source reports
Matrix reports can be useful source reports for dashboard components because grouped totals are already available in the report. Before adding the report to a dashboard, confirm that the row grouping, column grouping, summarized fields, and filters match the dashboard question. Save the Matrix report with a clear name, such as “Opportunities by Stage and Close Quarter”, and place it in a report folder with the right access.
Troubleshooting Salesforce Matrix report totals and grouping problems
- Column grouping is missing: add a field to the column grouping area, not only to the report columns list.
- Amount totals look wrong: check Show Me, date range, owner, stage, record type, and record visibility settings.
- Close Date columns are too many: group dates by month, quarter, or year instead of individual dates.
- Summarize option is unavailable: confirm that the field type supports Sum, Average, Min, or Max.
- Dashboard chart is hard to read: simplify row or column groupings before using the Matrix report as a dashboard source.
Editorial QA checklist for a Salesforce Matrix report tutorial
- The tutorial clearly explains that a Matrix report groups report data by both rows and columns.
- The example uses a relevant row grouping, such as Stage, and a relevant column grouping, such as Close Date.
- The summarized field is appropriate for the report, such as Sum of Opportunity Amount.
- The report filters are checked before interpreting row totals, column totals, and grand totals.
- The tutorial explains when a Matrix report is better than a Summary report.
Official Salesforce references for Matrix reports and field summaries
For current Salesforce report builder behavior, refer to Salesforce Trailhead on report formats and Salesforce Help on summarizing report fields. If you are working with Data Cloud reports, also check Salesforce release notes for matrix format in Data Cloud reports.
Salesforce Matrix report FAQs
What is a Matrix report in Salesforce?
A Matrix report in Salesforce is a report format that groups records by both rows and columns. It is used to compare summarized values across two dimensions, such as Opportunity Amount by Stage and Close Date.
When should I use a Salesforce Matrix report instead of a Summary report?
Use a Matrix report when you need row grouping and column grouping in the same report. Use a Summary report when one-direction grouping is enough, such as total Amount by Stage only.
Can a Salesforce Matrix report be used in a dashboard?
Yes. A Salesforce Matrix report can be used as a source report for dashboard components when the grouped totals support the dashboard chart or metric. Review filters and groupings before adding it to a dashboard.
What fields should be grouped in an Opportunity Matrix report?
Common Opportunity Matrix report groupings include Stage as the row group and Close Date as the column group. Other useful groupings include Owner, Type, Lead Source, Product Family, Territory, or Fiscal Period.
Why are totals missing or incorrect in my Salesforce Matrix report?
Totals may look incorrect when filters, date range, Show Me setting, record visibility, or summary settings do not match the intended report. Check the report type and confirm that the summarized field supports the selected operation.
Next Salesforce reporting format after Matrix reports
In this Salesforce tutorial we have successfully created Salesforce Matrix report, grouped report data by rows and columns, summarized Opportunity Amount, and reviewed conditional highlighting. In our upcoming Salesforce tutorial we will learn about another Salesforce report format called Joined report.