Summary reports in Salesforce help you group report rows, calculate subtotals, and review totals such as opportunity amount by Stage, Close Date, Type, Lead Source, or owner. A summary report is more useful than a tabular report when you need grouped business data instead of a simple row-by-row list.
In Salesforce reporting, a summary report groups rows by one or more fields and supports summary calculations such as Sum, Average, Min, and Max for numeric, currency, and other summarizable fields. Salesforce summary reports can use up to four grouping levels, which makes them suitable for pipeline, activity, case, lead, campaign, and revenue analysis.
- A Summary Report is a Salesforce report format that groups row data, supports sorting, and displays subtotals for grouped records.
- Summary reports display subtotals based on the value of a grouped field.
- Summary reports are commonly used as source reports for dashboards because grouped totals are easier to chart than detailed tabular rows.
What a Salesforce summary report shows after grouping report rows
A Salesforce summary report keeps the detail rows, but arranges those rows under one or more group headings. For example, an Opportunity report grouped by Stage shows opportunity records under stages such as Prospecting, Qualification, Proposal, Negotiation, Closed Won, and Closed Lost. If the Amount field is summarized, Salesforce can display subtotals for each Stage and a grand total for the whole report.
This format is useful when the question is not only “which records exist?” but also “how much, how many, or what total belongs to each group?” That is why summary reports are often used for sales pipeline totals, open case counts by priority, lead counts by source, and activity totals by owner.
Summary report vs tabular report in Salesforce
The main difference between a tabular report and a summary report in Salesforce is grouping. A tabular report displays records in a simple table. A summary report displays records in groups and can show subtotals for those groups.
| Report format | Best use | Grouping support | Subtotal support |
|---|---|---|---|
| Tabular report | Simple list of records, such as all open opportunities | No row grouping | No grouped subtotal rows |
| Summary report | Grouped analysis, such as opportunity amount by stage | Groups rows by field values | Shows subtotals and grand totals for summarized fields |
| Matrix report | Comparison across both rows and columns, such as amount by stage and month | Row and column grouping | Shows subtotals across row and column groups |
Creating summary reports in Salesforce.com
Summary reports in Salesforce.com are similar to Tabular reports, but they add row grouping and subtotal options. To create Summary reports login Salesforce and navigate to Reports | Create new Report.
In this Salesforce Training tutorial we are going to create Summary reports for the object Opportunities. The same reporting idea applies to other objects such as Leads, Accounts, Cases, Campaigns, and custom objects, provided the selected report type includes the fields you need.
Choose the Opportunity report type before adding Salesforce summary groups
Start by selecting a report type that contains the object and fields required for the report. For this example, choose an Opportunities report type. A report type controls which records and related fields are available in the report builder, so choose it carefully before you begin grouping and summarizing the report.
- Open the Reports tab in Salesforce.
- Click New Report.
- Select an Opportunity report type that contains the fields needed for your report.
- Click Start Report or continue to the report builder screen.
How to add Salesforce summary fields to the report preview pane
As shown above, add the required fields to the report preview pane and then group the report by the field you want to analyze. In Lightning Experience, you can add fields from the outline panel or columns area. In Salesforce Classic, you can drag fields into the preview pane. The exact label may vary by interface, but the reporting concept is the same: add the columns, group the report, and summarize the numeric fields.
- Drag Opportunity Name, Type, Lead Source, Amount, Probability, Close Date from field pane to grouping section of the preview pane.
- Wait for the loading dialog to complete.
- Select Summary format.
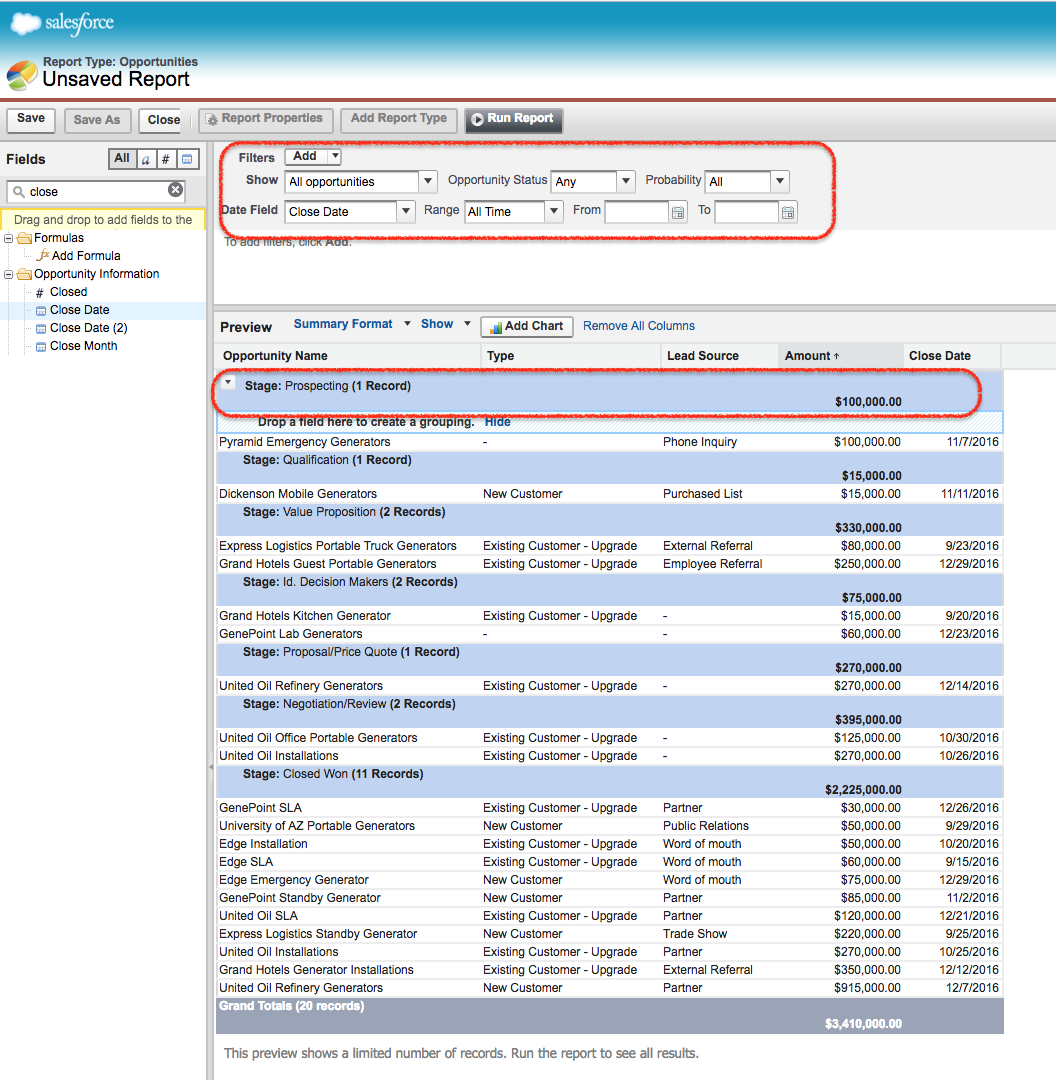
- In filter section area, select show all opportunities and select range as all time.
- Now go to Stage field on the column and select Group by this field.
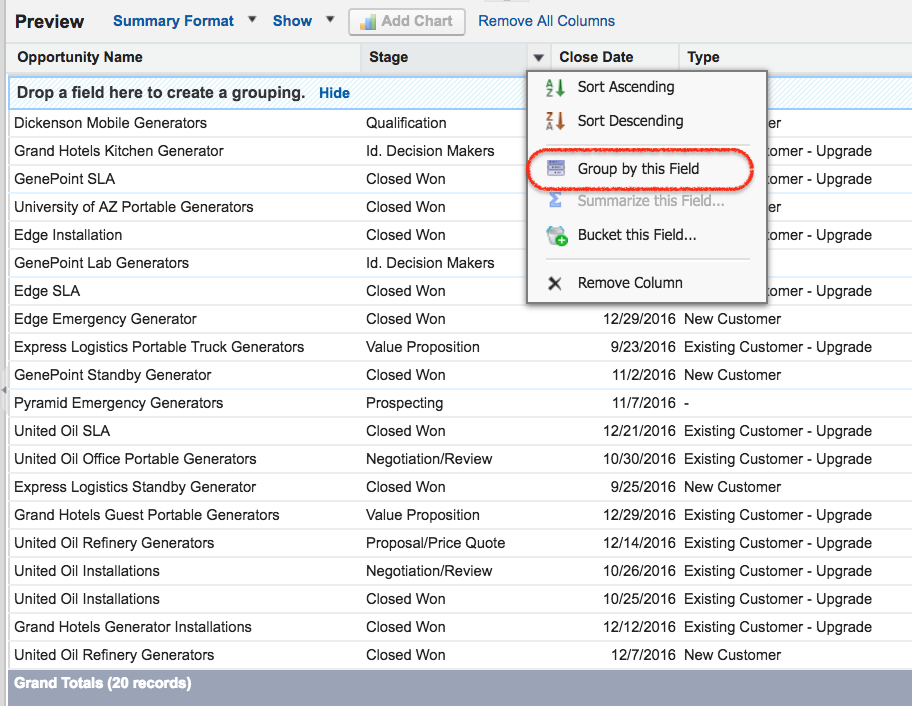
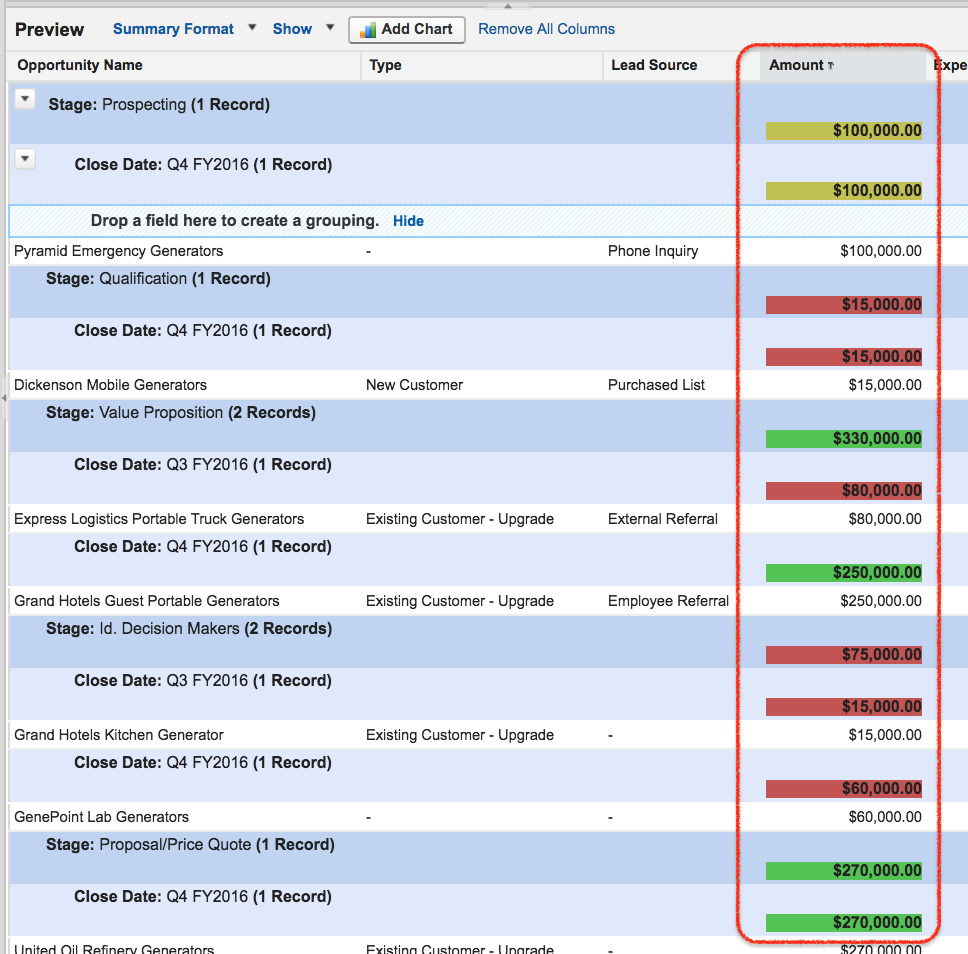
Now the report will appear as shown below.
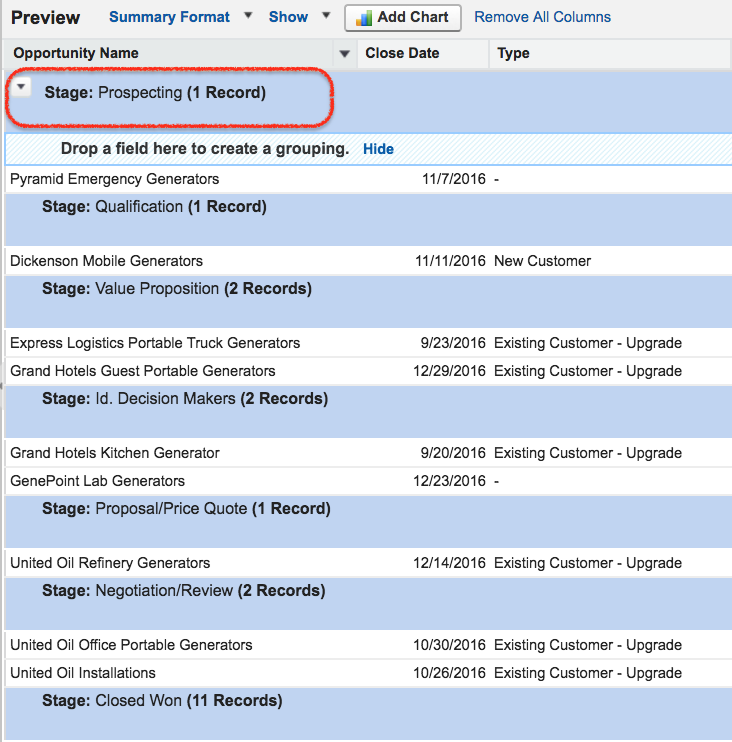
We have grouped row data based on Opportunity Stage. Drag and drop the Stage field to group rows. Salesforce Summary reports can have up to four grouping levels. A summary field is usually a number, percent, or currency field that can be summarized with Sum, Average, Min, or Max and displayed at group and grand total levels.
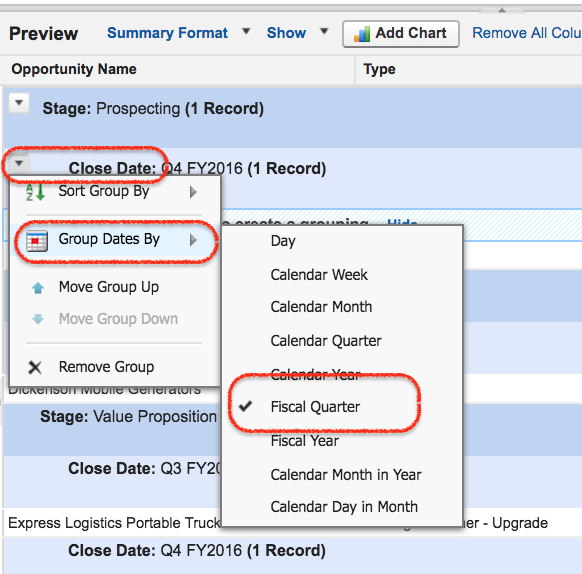
- We have grouped data by another field, Close Date.
Useful grouping choices for Salesforce opportunity summary reports
The grouping field should match the business question you want the report to answer. For Opportunity reports, these are common grouping choices:
- Stage: shows the pipeline amount and count of opportunities at each sales stage.
- Close Date: shows opportunities by date, month, quarter, or year, depending on how the date grouping is configured.
- Owner: shows record totals by sales representative, queue, or team member.
- Lead Source: shows how much pipeline or revenue is connected to each source.
- Type: separates new business, existing business, renewals, or other opportunity categories used in your org.
A good summary report usually starts with one primary grouping field. Add a second grouping only when it helps answer a more specific question, such as opportunity amount by Stage and then by Close Month. Too many grouping levels can make the report harder to read.
How to add a summary field to a Salesforce summary report
A summary field calculates values for each group and for the whole report. For example, if you summarize the Amount column by Sum, each Stage group can show the total opportunity amount under that Stage.
- To add Summary field in Summary report format, click on column drop down section and choose Summarize this field.
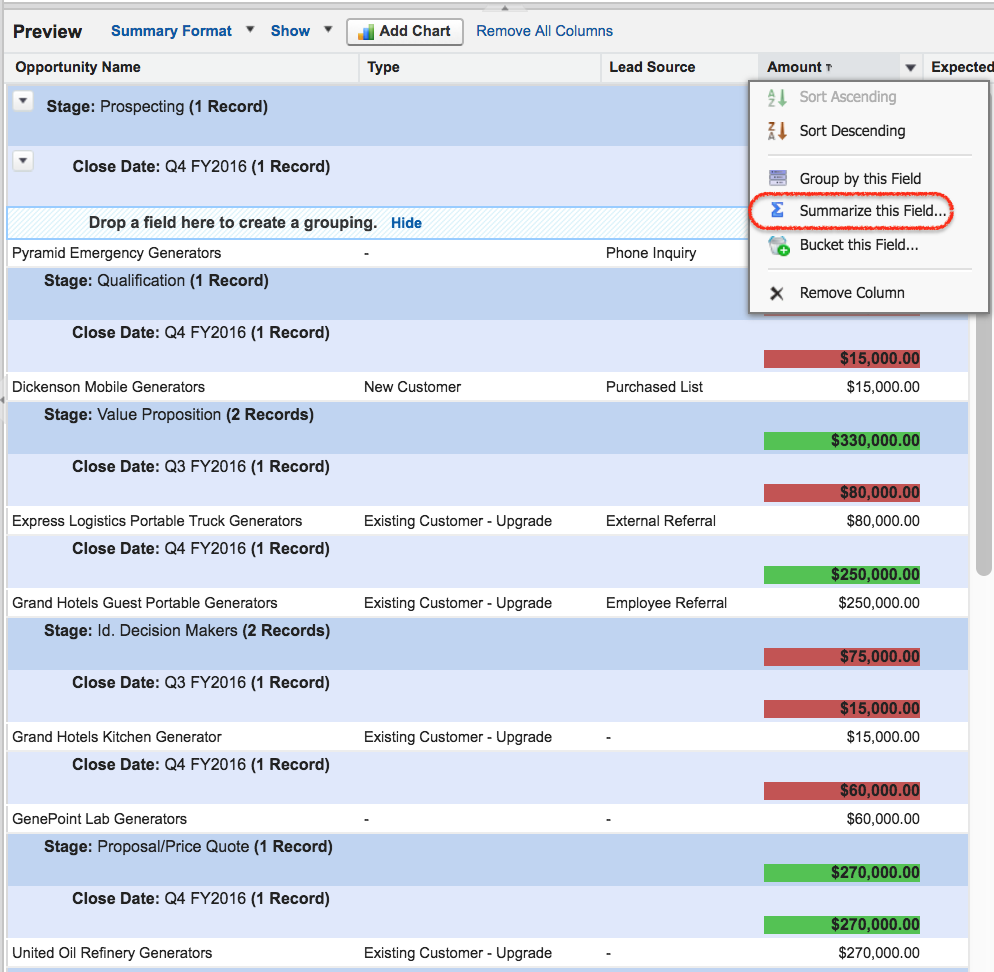
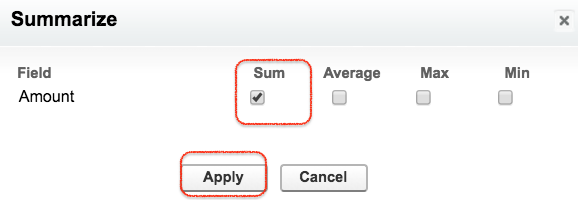
- Now pop up menu will be displayed.
- Select Sum and click on apply button.
Depending on the field type, Salesforce may allow summary operations such as Sum, Average, Maximum, and Minimum. Currency and number fields are typical candidates for summary calculations. Text fields are usually used for grouping, not for arithmetic summaries.
Salesforce summary formula for grouped report totals
A custom summary formula is different from simply selecting Sum or Average on a column. Use a Salesforce summary formula when you need a calculated value based on summarized report data. For example, a report can calculate a win rate, average deal size, weighted amount, or percentage of total at a group level.
In the report builder, custom summary formulas are created from the report outline or formula option, depending on the Salesforce interface. The formula result can be displayed at selected grouping levels and at the grand total level. Before adding a custom summary formula, make sure the report already has the required groupings and summarized fields.
- Use a normal summary, such as Sum of Amount, when you only need totals for a field.
- Use a custom summary formula when you need a calculation based on report totals, such as a rate, ratio, or percentage.
- Keep formula names clear because the same formula may appear in charts, dashboards, and exported report data.
Example summary formula ideas for Salesforce opportunity reports
| Business question | Possible Salesforce report setup | Useful result |
|---|---|---|
| How much pipeline is in each stage? | Group by Stage and summarize Amount by Sum | Total Amount for each Stage |
| Which lead sources produce the most pipeline? | Group by Lead Source and summarize Amount | Pipeline total by source |
| What is the average opportunity size by owner? | Group by Owner and summarize Amount by Average | Average deal size per owner |
| How does pipeline change by closing period? | Group by Close Date and summarize Amount | Total pipeline by month, quarter, or year |
What is Conditional Highlighting in Salesforce reports?
Conditional Highlighting is a powerful way to show values in report within given limits. We can specify colors for different ranges of values in reports using conditional highlighting.
In a Salesforce summary report, conditional highlighting is most useful when the summarized value needs quick visual review. For example, a sales manager may want low pipeline totals to appear in one color range and high pipeline totals in another range. Use breakpoints carefully so the colors reflect meaningful thresholds rather than arbitrary values.
- Click on show drop down and select Conditional Highlighting.
The color to show data for a low breakpoint and high breakpoint must be defined as shown below.
- Now click on Run report.
Now the above settings will produce a report result as shown.
- Click Run Report and the Summary report will be displayed as given below.
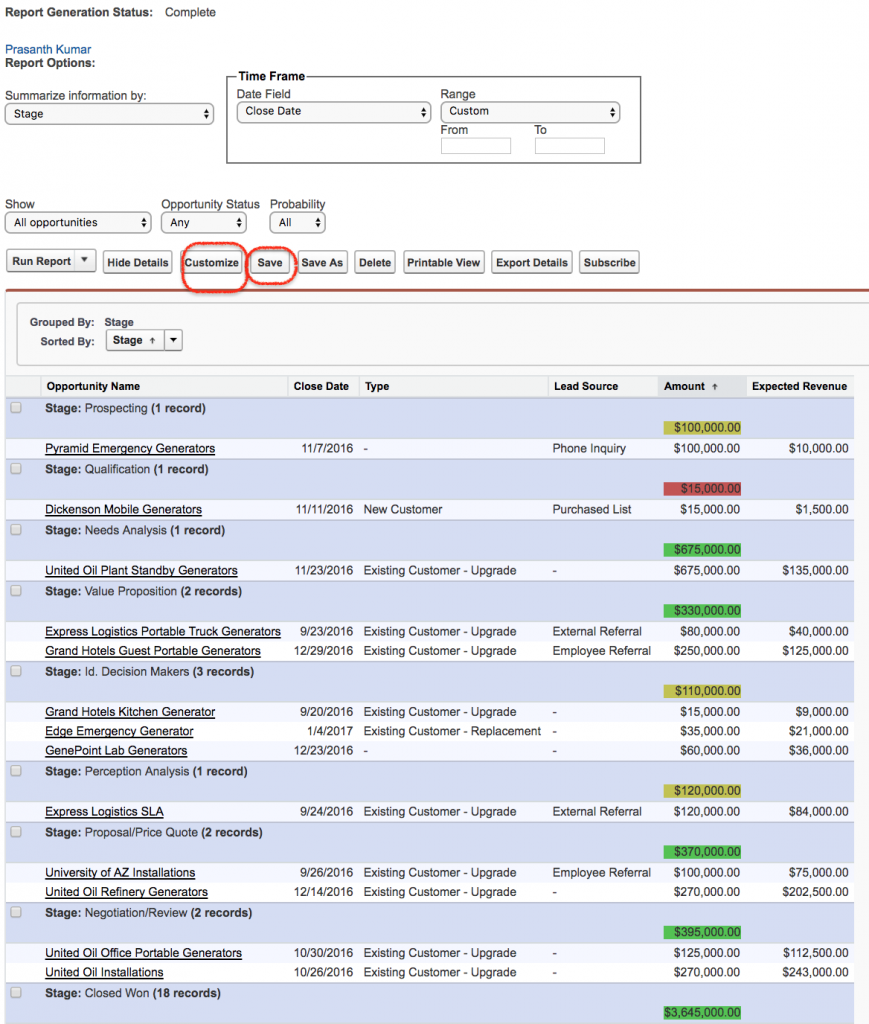
- Finally click on Save button.
- To edit Salesforce report click on customize button.
Saving and using Salesforce summary reports in dashboards
After building the summary report, give it a clear report name and save it in the correct report folder. Folder access controls who can view or edit the report. If the report will be used by a sales team, support team, or management dashboard, save it in a folder that has the right sharing settings.
Summary reports are useful dashboard sources because the grouped totals can be converted into charts, metric components, and tables. Before adding the report to a dashboard, run the report and confirm that filters, groupings, and totals match the expected business question.
Troubleshooting Salesforce summary report totals and missing fields
If a Salesforce summary report does not show the expected grouping or total, review the report type, filters, field permissions, and summary settings before changing the report design. Many reporting issues come from filters that exclude records or from choosing a report type that does not include the needed object relationship.
- Field not available: check whether the selected report type includes the field and whether the user has access to the field.
- Totals look too low: review date filters, owner filters, stage filters, and “Show Me” settings.
- Rows are not grouped: confirm that the field was added to the grouping area, not only to the columns list.
- Summary option is missing: check the field type, because not every field can be summarized with Sum, Average, Min, or Max.
- Dashboard chart is unclear: reduce unnecessary groupings or use a Matrix report when both row and column grouping are needed.
Editorial QA checklist for a Salesforce summary report tutorial
Use this checklist to review a Salesforce summary report before sharing it with users or using it in a dashboard.
- The report type matches the records and fields required for the business question.
- The report uses at least one meaningful grouping field, such as Stage, Close Date, Owner, Type, Lead Source, Priority, or Status.
- The summarized fields use the correct operation, such as Sum of Amount or Average of Amount.
- Date range, ownership, and status filters are checked before interpreting subtotals.
- Custom summary formulas are used only when a normal summary calculation is not enough.
- The saved report name explains the object, grouping, and purpose, such as “Opportunities by Stage – Current Fiscal Year”.
Official Salesforce report builder references for summary reports
For current Salesforce report builder behavior, refer to Salesforce Help for summarizing report fields, Salesforce Help for building custom summary formulas, and Salesforce Help for changing report formats.
Salesforce summary report FAQs
How do I summarize a Salesforce report?
To summarize a Salesforce report, open the report builder, add the required columns, group the report by a field such as Stage or Owner, and summarize a numeric or currency field such as Amount. The report then shows subtotals for each group and a grand total for the report.
How do I create a summary formula in a Salesforce report?
Create a custom summary formula from the report builder when you need a calculated result based on report totals. First add the required grouping and summary fields, then create the formula, choose where it should display, and validate the result by running the report.
What is the difference between a summary report and a tabular report in Salesforce?
A tabular report is a simple list of records without row grouping. A summary report groups rows by field values and can show subtotals, grand totals, and grouped charts. Use a summary report when grouped totals are more important than a plain record list.
What are Salesforce summary reports used for?
Salesforce summary reports are used to analyze grouped data such as opportunity amount by stage, cases by priority, leads by source, activities by owner, or revenue by close period. They are also useful as source reports for dashboards.
How many grouping levels can a Salesforce summary report have?
A Salesforce summary report can group rows up to four levels. For readability, start with one or two groupings and add more only when the business question requires deeper detail.
Next step after learning Salesforce summary reports
In this Salesforce tutorial we have learned about creating Summary reports, summarizing report fields, using groupings, adding conditional highlighting, and understanding when a custom summary formula is useful. In our upcoming Salesforce training we learn about creating Matrix reports in Salesforce.com.